Chinese Physics Letters, 2019, Vol. 36, No. 11, Article code 114201 Mid-IR Laser Generating Ultrasound in a Polyetheretherketone Polymer Ye Zhang (张晔), Gao-You Liu (刘高佑), Yi Chen (陈毅), Chuan-Peng Qian (钱传鹏), Ben-Rui Zhao (赵本瑞), Bao-Quan Yao (姚宝权)**, Tong-Yu Dai (戴通宇), Xiao-Ming Duan (段小明) Affiliations National Key Laboratory of Tunable Laser Technology, Harbin Institute of Technology, Harbin 150001 Received 31 August 2019, online 21 October 2019 **Corresponding author. Email: yaobq08@hit.edu.cn Citation Text: Zhang Y, Liu G Y, Chen Y, Qian C P and Zhao B R et al 2019 Chin. Phys. Lett. 36 114201    Abstract We demonstrate laser ultrasonic generation in polyetheretherketone (PEEK). A middle infrared ZnGeP$_{2}$ optical parametric oscillator (ZGP-OPO) pumped by a Q-switched Ho:YAG laser is employed as the ultrasonic excitation source. The ZGP-OPO has a spectral range of 3.2–3.4 μm. At an output wavelength of 3.4 μm, the maximum average output power of ZGP-OPO is 3.05 W with a pulse width of 24.3 ns, corresponding to a peak power of approximately 127.5 kW. The ultrasound is generated by the laser converted from 3.2 to 3.4 μm in the PEEK composite. The maximum ultrasonic signal amplitude in PEEK is 33 mV under the condition of thermoelastic excitation at 3.4 μm. Ablation occurs in the CPRF sample when the energy fluence is over 122.45 mJ/cm$^{2}$. PEEK has a stronger absorption at 3.4 μm and laser-ultrasound generation is influenced by the wavelength of the laser. DOI:10.1088/0256-307X/36/11/114201 PACS:42.55.Rz, 42.60.Gd, 42.72.Ai, 78.20.hc © 2019 Chinese Physics Society Article Text Mid-IR laser is used in many applications, such as lidar,[1] material processing[2] and remote sensing.[3] Lasers, such as the CO$_2$[4] laser and Nd:YAG laser,[5] have been used to generate ultrasound in metal,[6] ceramics[7] and silicon[8] for nondestructive testing (NDT). In recent years, they have been used as the ultrasonic excitation sources for inspection of composites in nondestructive testing (NDT) of aerospace industry.[9] Fiber-reinforced polymers have excellent mechanical properties, thermos physical properties and thermal ablation resistance and replaced widely traditional materials, aluminum and titanium alloys, for primary structures.[10–12] Therefore, it is necessary to ensure safety and reliability. Thus, laser ultrasound testing (LUT) is a potential method for NDT. Epoxy resins, such as the widely used diglyceryl ether of bisphenol A(DGEBA)-type epoxies are often employed in structural and aerospace applications.[13] For high temperature applications (above 200$^{\circ}\!$C), thermosetting polyimides, bismaleimide (BMI), and cyanate ester resins are employed because of their higher glass transition temperatures. High temperature thermoplastic resins, such as polyetherimide (PEI), polyetheretherketone (PEEK), and poly (phynylene sulfide) (PPS), are also candidates for some aerospace applications.[14] In 2009, Shekar et al. suggested that the ability of the composite laminates to undergo positive thermal expansion as confirmed through TMA and the glass. PEEK may be the potential application of composites in aerospace sector.[15] In 2011, Spiros et al. demonstrated an investigation on behavior of four new non-crimp fabric (NCF) composite materials developed using the thermoplastic resin PEEK, which was performed with the aim at assessing their potential for producing structural airframe parts of the required quality at reduced cost.[16] Such resins have CH/CH$_2$ bond and CH/CH$_2$ bond in polymers is resonant at 87.5 THz, which leads to its strong absorption at the wavelength of 3.4 µm.[17,18] With the variation of wavelength in 3–4 µm, there exists optimal absorption for different thicknesses of polymers.[19] Nonlinear optical conversion techniques may be the best method for widely tunable high-energy mid-IR laser sources. Dubois et al. used a potassium titanyl arsenate OPO in 2001.[19] In 2014, a KTA OPO was employed for laser ultrasonic generation.[20] However, the low thermal conductivity of PPLST and KTA led to a strong thermal load in the crystals, which limits the output power. These studies are focused on epoxy resin. However, so far, carbon fiber-reinforced peek has been only evaluated by x-ray and traditional ultrasonic testing[21] and laser-generated ultrasonic has not been employed on PEEK resin. In this Letter, we report laser ultrasonic generation in PEEK resin by a ring-shaped ZGP-OPO. The maximum average output power of the ZGP-OPO mid-IR laser is 3.05 W with a slope efficiency of 59.9% and a pulse width of 28 ns. The signal light wavelength varies from 3.2 to 3.4 µm. We obtain the laser ultrasonic generation at different frequencies (2.5 MHz and 5 MHz). We also study the laser ultrasonic generation in the PEEK sample with the tune of wavelength. The experimental setup is schematically shown in Fig. 1. The dimension of Ho:YAG crystal doped with Ho$^{3+}$ ion concentration of 0.3 at% was 5 mm in diameter and 80 mm in length. It was pumped by two orthogonally polarized Tm:YLF lasers at 1.91 µm. For the decreasing loss, the two end faces were coated with high transmission (HT) for the 1.91 and 2.09 µm. M1 was a plane-convex mirror, which had a coating film of high reflection (HR) at 2.09 µm and a curvature radius of 400 mm. Two dichronic mirrors M2 were coated with antireflection (AR) at 1.91 µm and HR at 2.09 µm. A plane-concave mirror M3 was employed as the output coupler with a curvature radius of 5000 mm and a transmission of 70% at 2.09 µm. An acoustic-optical modulator (AOM, MQH041-100DM-A05, Gooch & Housego) was utilized to Q-switch the laser. Ho:YAG crystals were all wrapped in 0.1-mm-thick indium foil and sunk in copper blocks. The temperature was controlled at 16$^{\circ}\!$C. For OPO, we established a single resonate rectangle-ring-cavity OPO. The pump beam was focused into ZGP crystal and its beam diameter was approximately 1.2 mm. M5 and M6 constituted the OPO cavity. Three plane mirrors M4 were coated with AR for the pump light and HR for signal light. M5 was the output coupler with transmission of 50% around 3.3 µm. The ZGP crystal was cut for type-I phase matching ($\theta=53.5^{\circ}$ and $\varphi=0^{\circ}$ relative to the optical axis) with dimensions of $6 \times 8$ mm$^{2}$ (in cross section) $\times 20.0$ mm (in length). The ZGP crystal was coated with HT for pump light (2.09 µm), signal light (3.3 µm) and idler light (5.7 µm). M6 played as a role of the filter with HT for signal light and AR for pump light and idler light (5.7 µm). The signal light was delivered onto the PEEK sample. An ultrasonic transducer was used to receive the signal and the signal was record by an oscilloscope (2 GHz, 10 GS/s).
cpl-36-11-114201-fig1.png
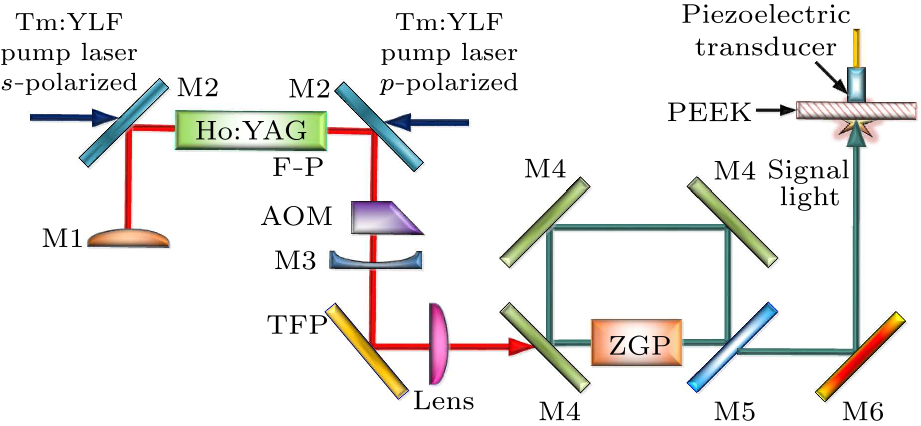
Fig. 1. Experimental setup of ultrasonic generation by the ZGP-OPO.
cpl-36-11-114201-fig2.png
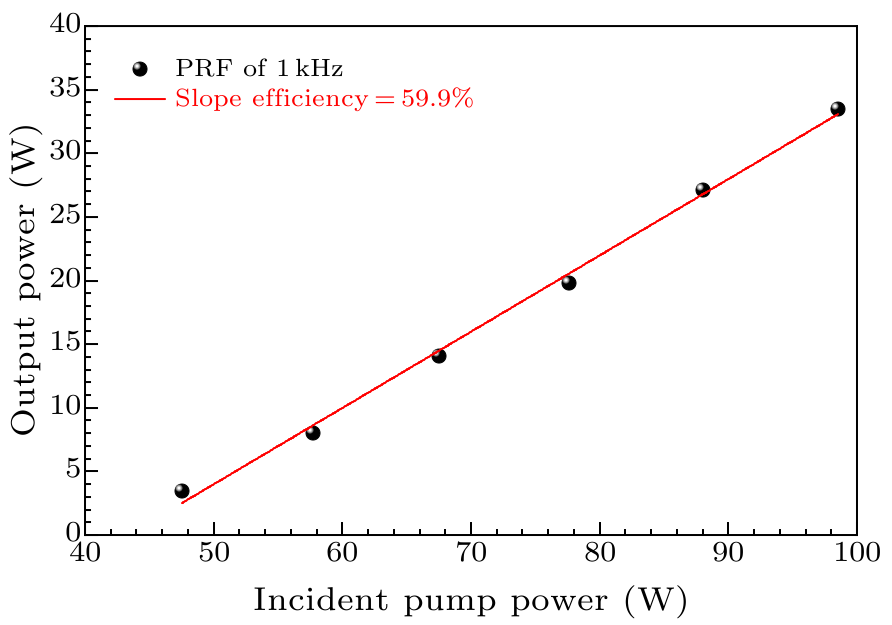
Fig. 2. The output powers of Ho:YAG laser in Q-switched modes.
The Ho:YAG laser performance is shown in Fig. 2. The laser was operated in the Q-switched mode with a repetition rate frequency of 1 kHz. The maximum average output power was 33.5 W at the incident pump power of 98.5 W. The corresponding slope efficiency was 59.9% and the optical-to-optical efficiency was 34.0%. The pulse width was measured by an InGaAs photodiode and recorded by a 600 MHz digital oscilloscope. The pulse width shows a steady decrease with the incident pump power as shown in Fig. 3. The minimum pulse width was 28 ns. We obtained a maximum pulse energy of 33.5 mJ with a peak power of approximately 1.19 MW. The inset in Fig. 3 was the spectrum of Ho:YAG laser and the central wavelength was 2090.9 nm.
cpl-36-11-114201-fig3.png
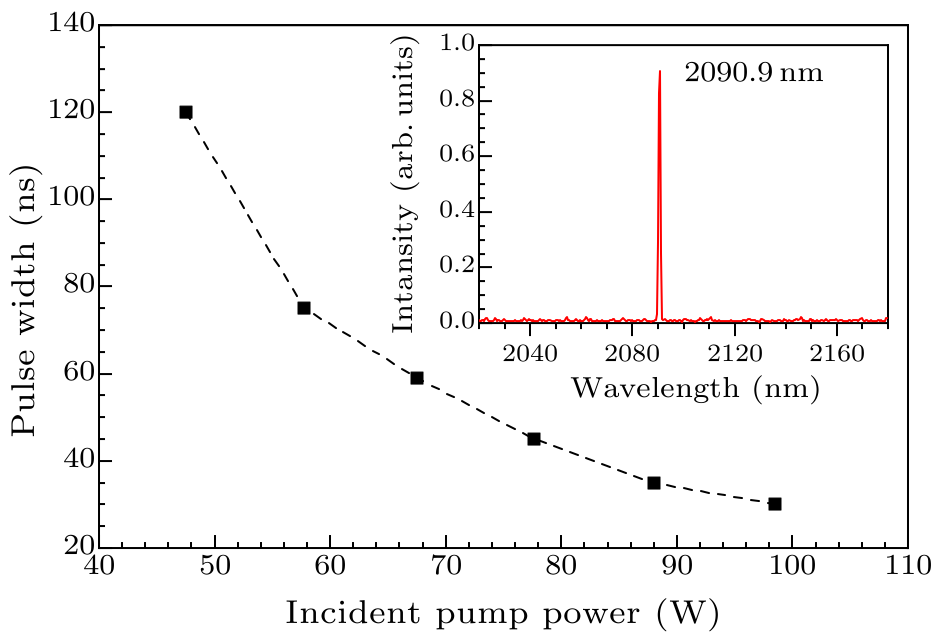
Fig. 3. The dependence of pulse width on the incident pump power. Inset: the spectrum of the Ho:YAG laser.
cpl-36-11-114201-fig4.png
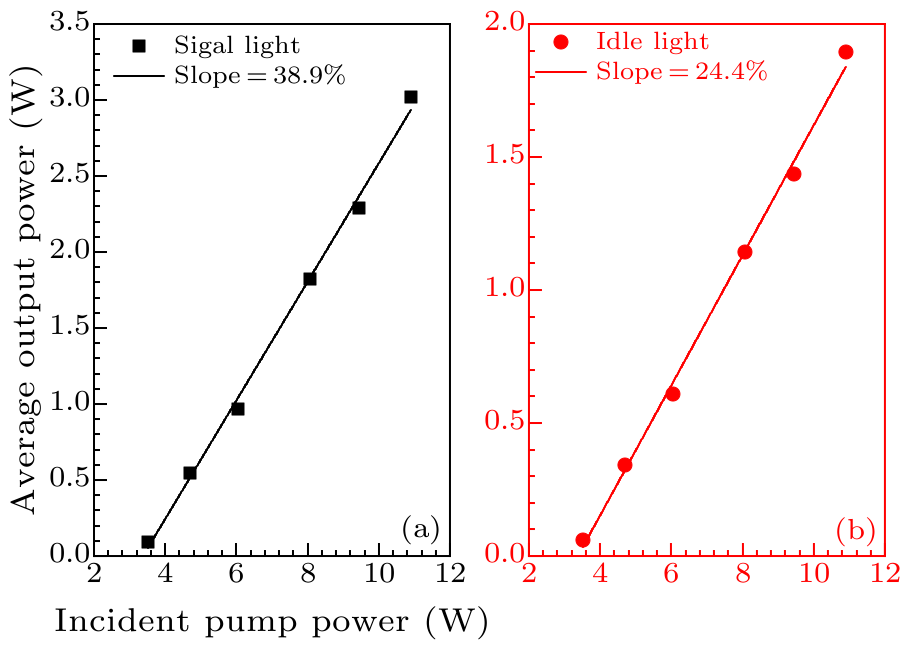
Fig. 4. The output performances of ZGP-OPO: (a) the signal light and (b) the idle light.
For the ZGP-OPO, we have investigated its output characteristics of signal light and idle light, respectively. The maximum average output power of signal light (3.4 µm) was 3.02 W and that of idle light (6.0 µm) was 1.82 W at the incident pump power of 10.9 W, with the corresponding slope efficiency of 38.9% and 24.4%, respectively, as shown in Fig. 4.
cpl-36-11-114201-fig5.png
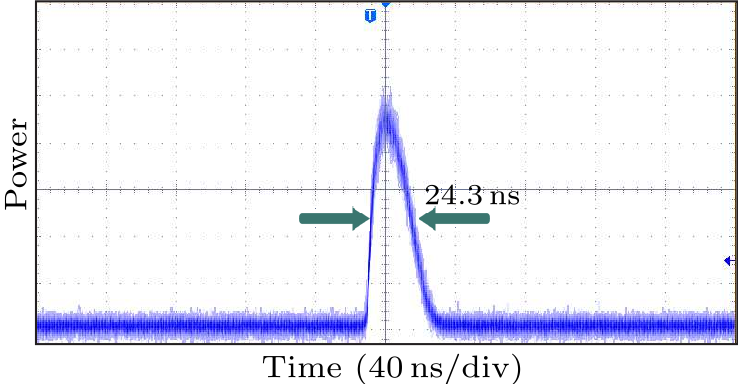
Fig. 5. The maximum pulse profile of the ZGP-OPO.
Meanwhile, the maximum pulse profile of 24.3 ns (as shown in Fig. 5) was recorded with an oscilloscope and HgCdTe detector, corresponding to the peak power of 127.5 kW. In addition, the spectrum of the signal light was recorded by a 150 mm WDG30-Z monochromator combined with an HgCdTe detector, as shown in Fig. 6. The central wavelength was turned from 3.2 to 3.4 µm. The spectral width (FWHM) for signal was approximately 16, 14, 12 nm, corresponding to 3.2, 3.3 and 3.4 µm, respectively.
cpl-36-11-114201-fig6.png
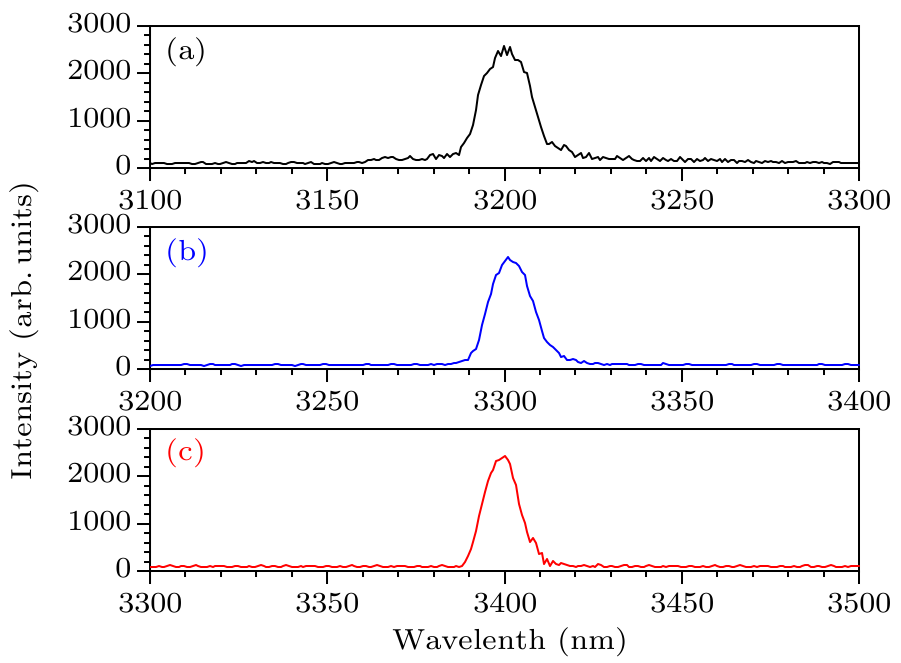
Fig. 6. The spectra of ZGP-OPO at different signal wavelengths: (a) 3.2 µm, (b) 3.3 µm and (c) 3.4 µm.
cpl-36-11-114201-fig7.png
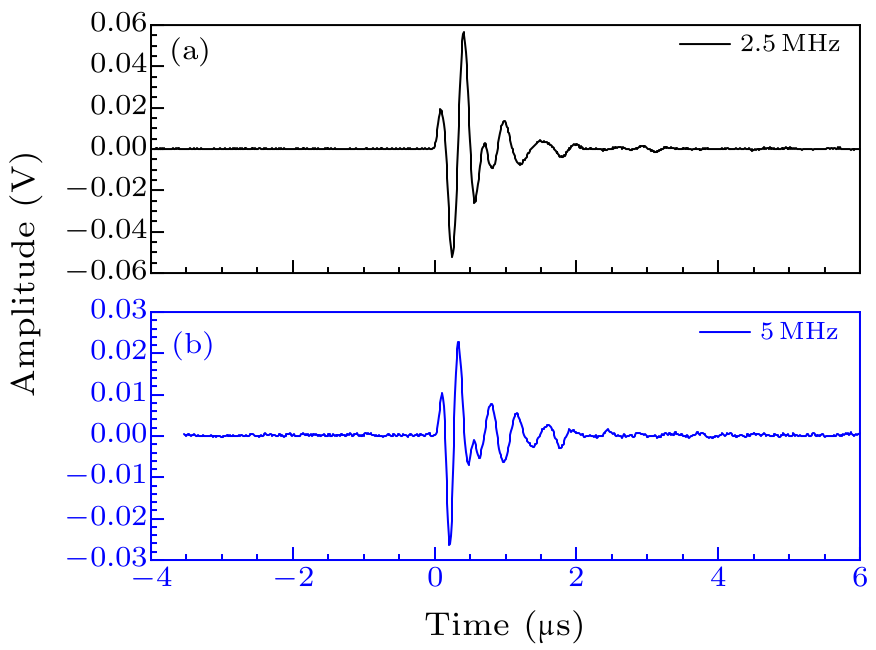
Fig. 7. The time profile of ultrasonic signal at different frequencies: (a) 2.5 MHz and (b) 5 MHz.
For laser ultrasonic detection, a Tektronix DPO 8204B digital phosphor oscilloscope (2 GHz, 10 GS/s) was utilized to record the time-domain waveform. The signal light was absorbed strongly and the irradiated area became the vibration source. The ultrasound was generated and propagated along the PEEK to the opposite surface where ultrasound can be detected by the piezoelectric transducer. Figure 7 shows the profile of longitudinal wave on the opposite position of the PEEK sample. The maximum amplitudes were 57.3 mV at 2.5 MHz and 27.8 mV at 5 MHz at the radiant fluence of 122.45 mJ/cm$^2$. PEEK has ultrasonic attenuation which is a function of ultrasonic frequency. The ultrasonic signal of 2.5 MHz had a higher amplitude and more efficiency than that of 5 MHz with the increase of laser fluence, as shown in Fig. 8. The signal strength was limited by the coupling of sample and piezoelectric transducer, which led to energy loss. For nondestructive detection, the ultrasonic excitation was kept in the thermoelastic regime. In the case of over 122.45 mJ/cm$^2$, the surface of the sample began to ablate.
cpl-36-11-114201-fig8.png
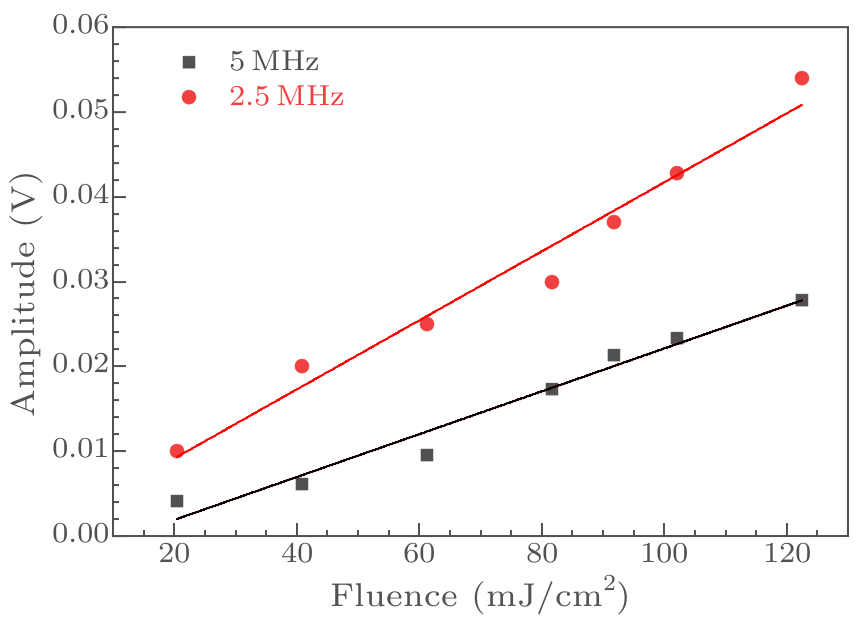
Fig. 8. The amplitude of ultrasonic signal versus laser fluence at different frequencies.
cpl-36-11-114201-fig9.png
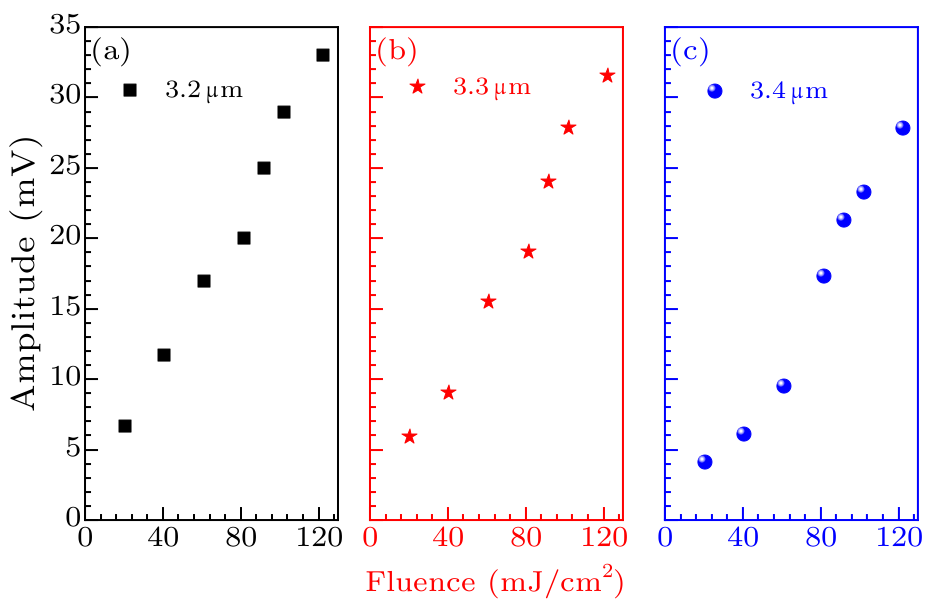
Fig. 9. The amplitude of ultrasonic signal (5 MHz) versus laser fluence at different wavelengths: (a) 3.2 µm, (b) 3.3 µm, and (c) 3.4 µm.
We also varied the output wavelength of ZGP OPO from 3.2 to 3.4 µm, and Fig. 9 shows the ultrasonic signal increased with the radiant fluence at different wavelengths. At the frequency of 5 MHz, the maximum amplitude was 33 mV when the signal light was 3.2 µm, which was more than 31.5 mV at 3.3 µm and 27.8 mV at 3.4 µm. For PEEK, the absorption of laser was influenced by the wavelength. The more absorption means shorter optical penetration depth. The optical penetration depth determines volume of vibration source which was formed by light-heat energy exchange. From Fig. 9, PEEK had a stronger absorption of laser at the wavelength of 3.4 µm. When the thickness of the PEEK sample was more than optical penetration depth, the deeper optical penetration depth led to a larger ultrasonic vibration source, which influenced the ultrasonic signal amplitude. In summary, laser ultrasonic generation in PEEK has been obtained by a mid-infrared ZGP optical parametric oscillator pumped by a Q-switched Ho:YAG laser. As the ultrasonic excitation source, the ZGP-OPO has a maximum output power of 3.05 W at a pulse repetition rate of 1 kHz. The maximum pulse width of 24.3 ns is achieved and the slope efficiency of signal light is 38.9%. The wavelength varies from 3.2 to 3.4 µm. At the wavelength of 3.4 µm, the maximum ultrasonic amplitude is 27.8 mV at 5 MHz and 57.3 mV at 2.5 MHz at the laser fluence of 122.45 mJ/cm$^{2}$.
References Coherent differential absorption lidar measurements of CO_2Welding of polymers using a 2μm thulium fiber laserTwenty years of Tm:Ho:YLF and LuLiF laser development for global wind and carbon dioxide active remote sensingUltrasonic generation with a pulsed TEA CO 2 laserGeneration of ultrasound by repetitively Q-switching a pulsed Nd:YAG laserHidden corrosion detection in aircraft aluminum structures using laser ultrasonics and wavelet transform signal analysisTemperature Dependence of Young's Modulus and Internal Friction in Alumina, Silicon Nitride, and Partially Stabilized Zirconia CeramicsUltrasound generation in single-crystal silicon using a pulsed Nd:YAG laserEvolution of industrial laser-ultrasonic systems for the inspection of compositesPolymers in aerospace applicationsCarbon fiber reinforced plastics in aircraft constructionA study on the potential of NCF thermoplastic composites for use in aeronautic structural applicationsMechanical properties of CFRP laminates manufactured from unidirectional prepregs using CSCNT-dispersed epoxyPolymer Matrix Composites: A Perspective for a Special Issue of Polymer ReviewsProperties of high modulus PEEK yarns for aerospace applicationsOptimization of temporal profile and optical penetration depth for laser-generation of ultrasound in polymer-matrix compositesExperimental verification of the effects of optical wavelength on the amplitude of laser generated ultrasound in polymer-matrix compositesExperimental comparison between optical spectroscopy and laser-ultrasound generation in polymer-matrix compositesNd:YAG laser/KTiOAsO4 (KTA) OPO system for laser ultrasound measurements on carbon-fiber-reinforced composite materials
[1] Koch G J, Barnes B W, Petros M et al 2004 Appl. Opt. 43 5092
[2] Mingareev I, Weirauch F, Olowinsky A et al 2012 Opt. Laser Technol. 44 2095
[3] Singh U N, Walsh B M, Yu J et al 2015 Opt. Mater. Express 5 827
[4] Edwards C, Taylor G S and Palmer S B 1989 J. Phys. D 22 1266
[5] Wagner J W, Deaton W B and Spicer J B 1988 Appl. Opt. 27 4696
[6] Silva M Z, Gouyon R and Lepoutre F 2003 Ultrasonics 41 301
[7] Matsumoto T, Nose T, Nagata Y et al 2004 J. Am. Ceram. Soc. 84 1521
[8] Dixon S, Edwards C, Palmer S B et al 1996 J. Phys. D 29 1345
[9] Dubois M, Drake T E et al 2011 Nondestr. Test. Eval. 26 213
[10] Wright W W 1991 Mater. & Des. 12 222
[11] Soutis C 2005 Mater. Sci. & Eng. A 412 171
[12] Pantelakis S, Christos K, Bernd M 2011 J. Poly. Eng. 31 159
[13] Tomohiro Y, Yutaka l, Shin I et al 2007 Compos. Part A 38 2121
[14] Michael R K 2012 Polym. Rev. 52 229
[15] Shekar R I, Kotresh T M, Krishna A S et al 2009 J. Appl. Polym. Sci. 112 2497
[16]Spiros P, Christos K and Bernd M 2011 J. Polym. Eng. 31 159
[17] Dubois M, Lorraine P W, Venchiarutti B et al 2000 AIP Conf. Proc. 509 287
[18] Dubois M, Lorraine P W et al 2002 Ultrasonics 40 809
[19] Dubois M, Lorraine P W, Filkins R J et al 2001 Appl. Phys. Lett. 79 1813
[20] Mahnke P, Peuser P and Huke P 2014 Appl. Phys. B 116 333
[21]David A F, Brent K H et al 2010 J. Mater. Sci. 14 3768