Chinese Physics Letters, 2021, Vol. 38, No. 8, Article code 088201 Effect of Fluorine Substitution on the Electrochemical Property and Structural Stability of a Lithium-Excess Cation Disordered Rock-Salt Cathode Panpan Li (李盼盼), Zhijie Feng (冯志杰), Tao Cheng (程涛), Yingchun Lyu (吕迎春)*, and Bingkun Guo (郭炳焜)* Affiliations Materials Genome Institute, Shanghai University, Shanghai 200444, China Received 29 April 2021; accepted 22 June 2021; published online 2 August 2021 Supported by National Natural Science Foundation of China (Grant Nos. 51602191 and 52072233), and the Beijing National Laboratory for Condensed Matter Physics.
*Corresponding authors. Email: yclyu@shu.edu.cn; guobingkun@shu.edu.cn
Citation Text: Li P P, Feng Z J, Cheng T, Lyv Y C, and Guo B K 2021 Chin. Phys. Lett. 38 088201    Abstract Lithium-excess cation disordered rock-salt materials have received much attention because of their high-capacity as a candidate for cathodes for lithium-ion batteries. The ultra-high specific capacity comes from the coordinated charge compensation of both transition metal and lattice oxygen. However, the oxygen redox at high voltage usually leads to irreversible oxygen release, thereby degrading the structure stability and electrochemical performance. Lithium-excess Li$_{1.14}$Ni$_{0.57+0.5 x}$Ti$_{0.19-0.5 x}$Mo$_{0.10}$O$_{2-x}$F$_{x}$ ($x=0$, 0.05, 0.10, 0.15, and 0.20) with different amounts of fluorine substitution were synthesized. Among them, Li$_{1.14}$Ni$_{0.620}$Ti$_{0.140}$Mo$_{0.10}$O$_{1.85}$F$_{0.15}$ exhibits a lower capacity decline, better rate performance, and lower structure damage. The effects of fluorine substitution on the electrochemical property and structural stability were systematic studied by x-ray photoelectron spectroscopy and in situ XRD etc. Results show that fluorine substitution reduces the average valence of the anion, allowing a larger proportion of low-valent redox active transition metals, increasing the transition metal redox capacity, inhibiting irreversible oxygen release and side reaction. Fluorine substitution further improves the structural stability and suppresses lattice deformation of the material. DOI:10.1088/0256-307X/38/8/088201 © 2021 Chinese Physics Society Article Text Owning to the limitation of fossil fuels and the emission of carbon dioxide, the need for novel high-capacity rechargeable batteries, which can store sustainable energy such as wind and solar energy, is becoming more and more urgent. Lithium-ion batteries have attracted much attention due to their high energy density, low self-discharge rate and excellent cycle durability.[1–3] Cathode materials, which are essential components of lithium-ion batteries, have limited the energy density and controlled the cost.[4,5] However, current commercial cathode materials, including layered LiCoO$_{2}$, spinel LiMn$_{2}$O$_{4}$ and olivine LiFePO$_{4}$, mainly obtain their capacity from transition metal ion redox.[6–9] It severely limited the capacity of the electrode and cannot meet the requirements of future energy storage applications.[10] New lithium-excess cation disordered rock-salt structure (DRX) cathode materials for lithium-ion batteries have attracted widespread attention because of their high specific capacity obtained from both cation and anion redox.[11,12] Earlier, it was believed that cation mixing would lead to a decrease in the capacity of layered material due to the blocking of the lithium-ion diffusion channel.[13,14] In 2014, Ceder's research group reported a lithium excess oxide Li–Mo–Cr–O, which offers a reversible capacity of 230 mA$\cdot$h$\cdot$g$^{-1}$ with a disordered rock-salt phase.[15] The high capacity was obtained through the 0-TM percolation network, a lithium-ion migration pathway which does not exist in stoichiometric layered materials.[16,17] The formation of percolation network is highly related to the excess of lithium ions, it requires transition metals with high chemical valence for charge compensation.[17,18] Therefore, the key for designing and optimizing a DRX cathode material is to maximize the redox capability of transition metals while maintaining the lithium-excess level above the percolation threshold to ensure an acceptable rate capability.[19,20] Many studies have reported on lithium-excess DRXs based on high-valent transition metals, including Li$_{2}$MoO$_{3}$, Li$_{2}$TiO$_{3,}$ Li$_{2}$VO$_{3}$, Li$_{3}$NbO$_{4}$, Li$_{3}$SbO$_{4}$, or Li$_{4}$MoO$_{5}$, etc., which can form a solid solution with LiMO$_{2}$ (M = Ni, Co, Mn, Fe, etc.).[11,21–29] Li$_{4}$MoO$_{5}$-based DRXs usually show a lower band gap, which indicates a higher electrical conductivity. The Mo–O key structure is stable, which can reduce or avoid the occurrence of oxygen loss. Thus, they can offer a high specific capacity at room temperature and lower voltage ($\le $4.5 V), which is compatible with electrochemical windows of the electrolyte.[22,30] Despite the high specific capacity, there are some issues that still need to be solved before their application. Li-excess DRXs usually show poor electronic and ion conductivity.[11,15,31,32] Reversible oxygen redox can increase additional capacity, but excessive oxygen redox is likely to cause the loss of surface oxygen and affect the diffusion of lithium ions. During the oxygen redox at high voltage, the electrode may react with the electrolyte and form a solid electrolyte interphase (SEI) film. These lead to severe discharge specific capacity degradation, poor rate performance and large voltage plateau declines during the cycle. Some strategies and methods have been adopted to modify DRX materials. Element substitution is an effective solution that can be used to adjust the basic physical properties of electrodes by changing the band gap, cation ordering, defect concentration and charge redistribution. Among them, fluorine is often used to partially replace oxygen to stabilize the crystal structure, prevent lattice oxygen loss and improve the electrochemical performance of the material, benefiting from the higher formation energy of transition metal-fluorine covalent bond than that of transition metal-oxygen.[33–36] Substituting F for O can reduce the average valence of the anion sublattice, thus allowing a larger proportion of low-valent redox active transition metals (such as Mn$^{2+}$ or Ni$^{2+}$), increasing the transition metal redox capacity.[34] Partial substitution of fluorine in the oxyanion sublattice of Li$_{1.2}$Mn$_{0.6}$Nb$_{0.2}$O$_{2}$ increases the capacity contribution of transition metals redox, and reduces the irreversible oxygen redox, making it more stable.[37] Li$_{1.2}$Mn$_{0.55}$Ti$_{0.25}$O$_{1.85}$F$_{0.15}$ shows a reversible capacity of 275 mA$\cdot$h$\cdot$g$^{-1}$ since fluorination enhances the reversible lattice oxygen redox, suppresses irreversible gas release and surface reaction, increases the average discharge voltage of the material.[38] Lee et al. reported a high initial capacity ($> 300$ mA$\cdot$h$\cdot$g$^{-1}$) and high energy density (1000 W$\cdot$h$\cdot$kg$^{-1}$) of Li$_{2}$Mn$_{2/3}$Nb$_{1/3}$O$_{2}$F and Li$_{2}$Mn$_{1/2}$Ti$_{1/2}$O$_{2}$F disordered rock-salt compounds.[39] Although fluorine doping can significantly improve cathode performance, the real effects of F substitution on the redox process of transition metal ions and oxygen ions, and the structural evolution are still not clear. In this study, Li$_{1.14}$Ni$_{0.57}$Ti$_{0.19}$Mo$_{0.10}$O$_{2}$ and a series of F-substituted samples Li$_{1.14}$Ni$_{0.57+0.5 x}$ Ti$_{0.19-0.5 x}$Mo$_{0.10}$O$_{2- x}$F$_{x}$ ($x=0.05$, 0.10, 0.15, and 0.20) were prepared. Among the samples, Li$_{1.14}$Ni$_{0.620}$Ti$_{0.140}$Mo$_{0.10}$O$_{1.85}$F$_{0.15}$ exhibits a less capacity fading than Li$_{1.14}$Ni$_{0.57}$Ti$_{0.19}$Mo$_{0.10}$O$_{2}$. The mechanism of lithium deintercalation and the effect of F-substitution on the electrochemical performance and structural stability were studied by a variety of characterization methods. It is found that fluorine substitution reduces the average valence of the anion, allowing a larger proportion of low-valent redox active transition metals, thus increasing the transition metal redox capacity, inhibiting irreversible oxygen release and side reaction. The structural degradation and capacity decay of the cathode are mitigated by fluorine substitution. ExperimentalMaterial Preparation. A solid-state method was used for synthesizing DRX Li$_{1.14}$Ni$_{0.57+0.5 x}$Ti$_{0.19-0.5 x}$Mo$_{0.10}$O$_{2-x}$F$_{x}$ ($x=0$, 0.05, 0.10, 0.15, and 0.20). In a typical synthesis, stoichiometric amount of CH$_{3}$COOLi$\cdot$2H$_{2}$O (Alfa Aesar, 99%), Ni(CH$_{3}$COO)$_{2}\cdot$4H$_{2}$O (Alfa Aesar, 98%), TiO$_{2}$ (aladdin, 99.9%), MoO$_{3}$ (Alfa Aesar, 99.5%) and LiF (Alfa Aesar, 99.85%) were added to deionized water and stirred twelve hours. Then the solution was heated on the heating platform of a magnetic stirrer to evaporate the solvent. The resulting product was ground into powder. The powder was sintered at 800 ℃ for six hours for samples with $x=0,\, 0.05,\, 0.10$, and at 750 ℃ for six hours for samples with $x=0.15$ and 0.20, aiming to avoid the NiO or TiO$_{x}$ impurity. The samples were heated in air with the heating rate of 5 ℃/min. In the following, LNTMO-FX ($X=0,\, 5,\, 10,\, 15$, and 20) represents Li$_{1.14}$Ni$_{0.57+0.5x}$Ti$_{0.19-0.5x}$Mo$_{0.10}$O$_{2-x}$F$_{x}$ ($x=0,\, 0.05,\, 0.10,\, 0.15$, and 0.20) for simplicity. Electrochemical Characterization. The synthesized active material, acetylene black and poly-vinylidene fluoride (PVDF) were mixed by $8\!:\!1\!:\!1$ in weight ratio in N-methyl-pyrrolidone (NMP) with a mortar and pestle. The obtained slurry was coated on an aluminum foil then dried in an oven under 70 ℃ for three hours, then dried in a vacuum oven at 100℃ overnight. To assemble coin cells for electrochemistry tests, lithium metal was used as a counter electrode, Celgard 2300 film was used as separator, and 1 M lithium hexaflouride phosphate (LiPF$_{6}$) in a mixture of ethylene carbonate and dimethyl carbonate (EC: DMC, $1\!:\!1$ volume ratio) was used as electrolyte, respectively. The galvanostatic charge-discharge test, rate test, and galvanostatic intermittent titration technique (GITT) were measured on a Land CT2001A battery test instrument within a potential range of 1.5–4.8 V vs Li/Li$^{+}$ at room temperature. Cyclic voltammetry (CV) tests were conducted between 1.5 and 4.8 V vs Li/Li$^{+}$ at 0.1 mV/s using a Solartron analytical 1470 Cell Test System. Electrochemical impedance spectroscopy (EIS) was tested under open circuit potential conditions in a frequency range of 100 kHz to 0.1 Hz using the Solartron analytical 1470 Cell Test System. Materials Characterization. In order to analyze the chemical element composition ratio of the synthesized samples, an inductively coupled plasma optical emission spectrometer (ICP-OES) was tested via PERKINE 7300DV. The powder x-ray diffraction patterns of as-prepared samples were collected from a PANalytical Empyrean x-ray diffractometer with Cu $K_\alpha$ radiation ($\lambda_{1}=1.540598$ Å, $\lambda_{2}=1.544426$ Å). The in situ XRD was measured using a specially designed battery case with aluminum foil as the current collector and x-ray window. The morphology of the synthesized materials was investigated using a scanning electron microscope (SEM) and an energy dispersive spectrometer (EDS) via Hitachi SU8230. The high-resolution transmission electron microscopy (HR-TEM) images were obtained on Tecnai G2 F20 TEM. The oxidation states of transition metals and oxygen ions were obtained by x-ray photoelectron spectroscopy (XPS) on ESCALAB 250xi. Results and Discussions. ICP measurements show that the compositions of the LNTMO-FX samples are close to the target chemical formula, as shown in Table 1. The particle morphology and elemental distribution of the samples were further examined by SEM and EDS mapping, respectively. Figure 2(a) and Fig. S1 in the Supplementary Material show irregular polyhedral particles of LNTMO-FX with an average particle size of approximately 100 nm. Uniform elemental distributions of Ni, Ti, Mo, O, and F are observed on all samples, as shown in Figs. 2(b) and S1. It is demonstrated that fluorine has successfully entered the bulk phase of LNTMO-FX.
Table 1. Composition of the samples based on ICP-OES analysis.
Samples Theoretical molar content of Experimental molar content of
Li : Ni : Ti : Mo Li : Ni : Ti : Mo
Li$_{1.14}$Ni$_{0.57}$Ti$_{0.19}$Mo$_{0.10}$O$_{2 }(x=0$) $1.14\!:\!0.57\!:\!0.19\!:\!0.10$ $1.115\!:\!0.576\!:\!0.195\!:\!0.114$
Li$_{1.14}$Ni$_{0.595}$Ti$_{0.165}$Mo$_{0.10}$O$_{1.95}$F$_{0.05 }(x=0.05$) $1.14\!:\!0.595\!:\!0.165\!:\!0.10$ $1.172\!:\!0.568\!:\!0.156\!:\!0.104$
Li$_{1.14}$Ni$_{0.620}$Ti$_{0.140}$Mo$_{0.10}$O$_{1.90}$F$_{0.10 }(x=0.10$) $1.14\!:\!0.620\!:\!0.140\!:\!0.10$ $1.134\!:\!0.626\!:\!0.138\!:\!0.102$
Li$_{1.14}$Ni$_{0.645}$Ti$_{0.115}$Mo$_{0.10}$O$_{1.85}$F$_{0.15 }(x=0.15$) $1.14\!:\!0.645\!:\!0.115\!:\!0.10$ $1.132\!:\!0.666\!:\!0.100\!:\!0.102$
Li$_{1.14}$Ni$_{0.670}$Ti$_{0.090}$Mo$_{0.10}$O$_{1.80}$F$_{0.20 }(x=0.20$) $1.14\!:\!0.670\!:\!0.090\!:\!0.10$ $1.174\!:\!0.638\!:\!0.085\!:\!0.103$
Table 2. The influence of F-doping on the structure of Li$_{1.14}$Ni$_{0.57+0.5 x}$Ti$_{0.19-0.5 x}$Mo$_{0.10}$O$_{2-x}$F$_{x}$ ($x=0,\, 0.05,\, 0.10,\, 0.15$, and 0.20).
Li$_{1.14}$Ni$_{0.57+0.5 x}$Ti$_{0.19-0.5 x}$Mo$_{0.10}$O$_{2-x}$F$_{x}$ ($x=0,\, 0.05,\, 0.10,\, 0.15$, and 0.20) $I$(003)$_{\rm L}$/$I$(104)$_{\rm L}$
Li$_{1.14}$Ni$_{0.57}$Ti$_{0.19}$Mo$_{0.10}$O$_{2 }(x=0$) 0.43
Li$_{1.14}$Ni$_{0.595}$Ti$_{0.165}$Mo$_{0.10}$O$_{1.95}$F$_{0.05 }(x=0.05$) 0.29
Li$_{1.14}$Ni$_{0.620}$Ti$_{0.140}$Mo$_{0.10}$O$_{1.90}$F$_{0.10 }(x=0.10$) 0.07
Li$_{1.14}$Ni$_{0.645}$Ti$_{0.115}$Mo$_{0.10}$O$_{1.85}$F$_{0.15 }(x=0.15$) 0.08
Li$_{1.14}$Ni$_{0.670}$Ti$_{0.090}$Mo$_{0.10}$O$_{1.80}$F$_{0.20 }(x=0.20$) 0.10
cpl-38-8-088201-fig1.png
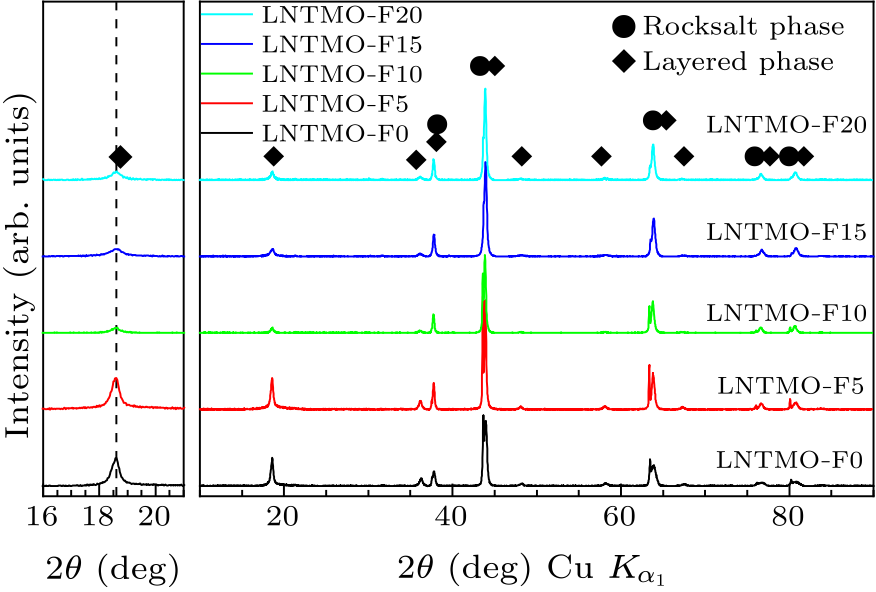
Fig. 1. x-ray diffraction patterns of Li$_{1.14}$Ni$_{0.57+0.5 x}$Ti$_{0.19-0.5 x}$Mo$_{0.10}$O$_{2-x}$F$_{x}$ ($x=0,\, 0.05,\, 0.10,\, 0.15$, and 0.20).
XRD results of the samples are shown in Fig. 1. All diffraction peaks can be indexed cation disordered cubic rock-salt phase ($Fm\bar{3}m$) represented by filled circles and layered hexagonal phase ($R\bar{3}m$) represented by diamonds. It matches well with the former research.[38,40] For the rock-salt phase, O ions occupy the $4b$ Wyckoff sites, while Li, Ni, Ti and Mo ions indiscriminately occupy the $4a$ Wyckoff sites.[41] For the layered hexagonal phase, lithium ions and transition metal ions occupy the alternate (111) planes of the rock-salt structure. The ratio of $I$(003)$_{\rm L}$/$I$(104)$_{\rm L}$ in the layered phase represents the degree of cation ordering.[42] Comparing the $I$(003)$_{\rm L}$/$I$(104)$_{\rm L}$, the change of rock-salt phase content with F-substitution can be observed. The intensities of (003) peaks at 18.60$^{\circ}$ are reduced with F-substitution, and the $I$(003)$_{\rm L}$/$I$(104)$_{\rm L}$ values of all fluorine-substituted samples are lower compared with samples undoped with fluorine. It reveals that after F substitution, the amount of rock-salt phase increases, as summarized in Table 2, which may result from the increase amount of divalent nickel. In LNTMO-F15 and LNTMO-F20, the content of high-valent transition metal ions that constitute the framework of the rock-salt phase are reduced, leading to a content decrease of the rock-salt phase, while it is still more than that of LNTMO-F0. In addition to the shortcomings of cation migration, the layered phase is usually unstable during cycle and the safety of the battery may be affected, while the rock-salt phase usually shows no phase transitions during charging and discharging.[43,44] Therefore, the increase of the rock-salt phase in LNTMO-FX is expected to improve the structural stability during cycling. According to the Rietveld refinement results (Fig. S2), the amount of rock-salt phase in LNTMO-F15 [84(4)%] is higher than LNTMO-F0 [34(1)%]. The lattice parameters of LNTMO-F15 [$a_{_{\scriptstyle \rm R}}=4.121(2)$ Å, $a_{_{\scriptstyle \rm L}}=2.903(1)$ Å, $c_{_{\scriptstyle \rm L}}=14.266(9)$ Å] are lightly smaller than that of LNTMO-F0 [$a_{_{\scriptstyle \rm R}}=4.139(1)$ Å, $a_{_{\scriptstyle \rm L}}=2.904(8)$ Å, $c_{_{\scriptstyle \rm L}}=14.293(5)$ Å], which suggests that fluorine is successfully incorporated into the bulk of the material due to the ion radius of F$^{-}$ (1.19 Å) being smaller than O$^{2-}$ (1.26 Å) at the octahedral environment.[45]
cpl-38-8-088201-fig2.png
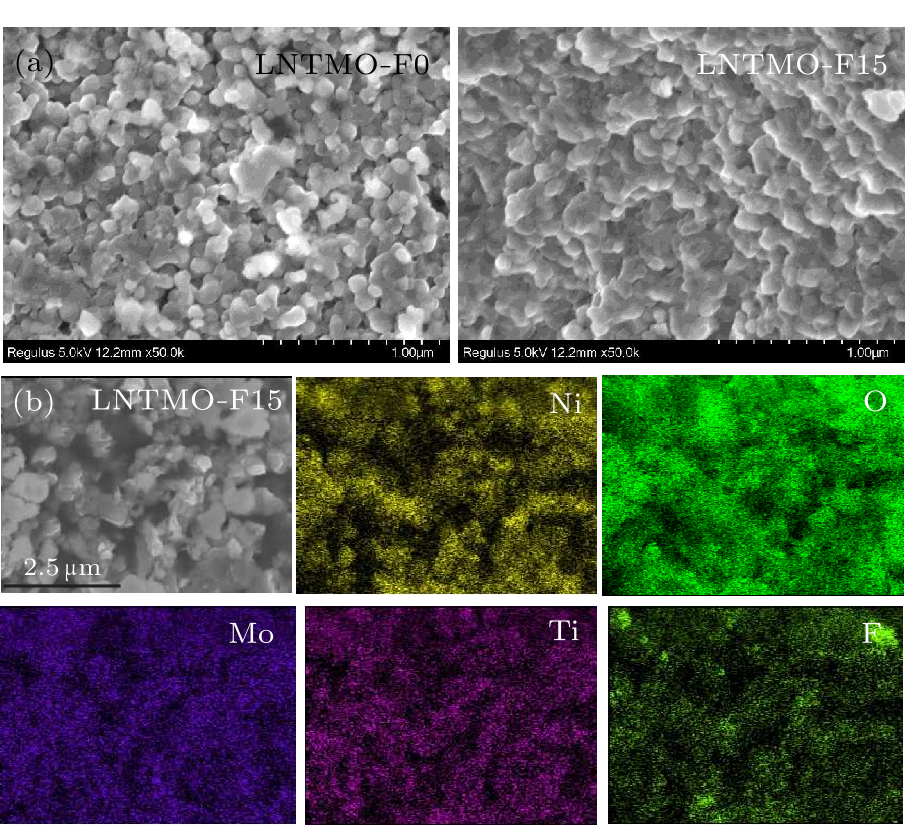
Fig. 2. (a) Morphological observation from SEM images of Li$_{1.14}$Ni$_{0.57+0.5 x}$Ti$_{0.19-0.5 x}$Mo$_{0.10}$O$_{2-x}$F$_{x}$ ($x=0,\, 0.15$). (b) EDS mapping of elemental distributions of Li$_{1.14}$Ni$_{0.57+0.5 x}$Ti$_{0.19-0.5 x}$Mo$_{0.10}$O$_{2-x}$F$_{x}$ ($x=0.15$).
cpl-38-8-088201-fig3.png
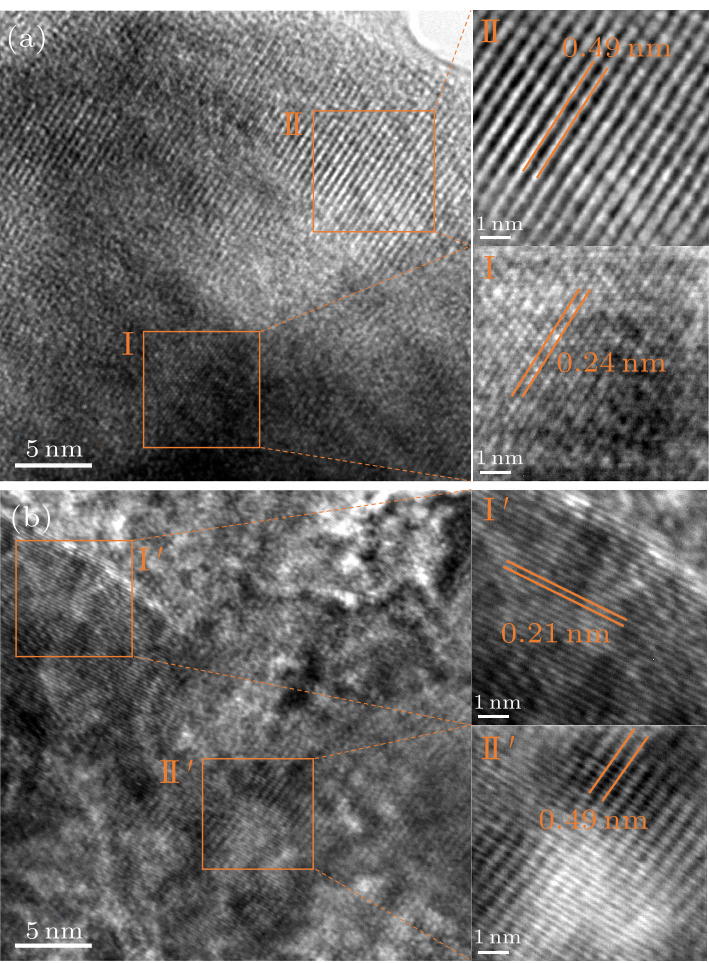
Fig. 3. HR-TEM images of (a) Li$_{1.14}$Ni$_{0.57+0.5 x}$Ti$_{0.19-0.5 x}$Mo$_{0.10}$O$_{2-x}$F$_{x}$ ($x=0$), (b) Li$_{1.14}$Ni$_{0.57+0.5 x}$Ti$_{0.19-0.5 x}$Mo$_{0.10}$O$_{2-x}$F$_{x}$ ($x=0.15$).
The high-resolution transmission electron microscopy (HR-TEM) in Fig. 3 confirms that both materials contain cation disordered rock-salt and the layered phase by the corresponding $d$-spacing along the [010]$_{\rm L}$ or [0$\bar{1}$1]$_{\rm R}$ zone axis, which are determined in Fig. S3 by the electron diffraction patterns. HR-TEM images of the LNTMO-F0 and LNTMO-F15 show clear interplanar spacing lattices of 0.49 nm (region II from the LNTMO-F0 and region II$^{\prime}$ from the LNTMO-F15) in the HR-TEM pattern for the bulk in Fig. 3 corresponding to (003) planes of the layered structure.[15,46] The interplanar spacing with 0.21 nm (region I$^{\prime}$ from the LNTMO-F15) belongs to the (200) plane of cation disordered rock-salt structure.[40] In the pattern of LNTMO-F0 in Fig. 3 (region I), the $d$-spacing with 0.24 nm represents the (111) plane of the cation disordered rock-salt phase. XPS measurements of LNTMO-FX powders are shown in Fig. S4. Fluorine elements are detected in samples with F-substitution, and the intensity of the fluorine signal enhances with the increase of F concentration. The peak position of Ni $2p_{3/2}$ becomes smaller as the amount of fluorine increases, demonstrating that F-substitution reduces the average Ni valence. The content of divalent nickel in LNTMO-F0 is 50.23%, while the content of divalent nickel in LNTMO-F15 is 58.76%. The lower valence of the transition metal may help the battery to obtain a higher capacity. The valances of Mo and Ti remain $+$6 and $+$4 in all the samples, which are the highest chemical states and benefit the structure stability.[47,48] The electrochemical performances of the samples are shown in Fig. 4. In the CV curves in Fig. 4(a), two anodic peaks are observed at 4.0 and 4.45 V, demonstrating the oxidation of Ni$^{2+}$ and O$^{2-}$, respectively.[35,49] Sample LNTMO-F15 shows a decreased oxygen activity than that of LNTMO-F0, due to the stronger transition metal-fluorine bonding.[50] Upon discharging, the reduction of oxygen ions occurs first centered at 4.2 V, and then the reduction of Ni$^{4+}$ occurs at about 3.5 V, illustrating the reversibility of oxygen and nickel redox.[51] The cathodic peak below 1.8 V corresponds to the further reduction of Ni$^{3+}$ to Ni$^{2+}$.[49] During the second cycle, the potential difference between nickel oxidation and nickel reduction decreases with fluorine substitution. In addition, the oxygen oxidation peak still exists, indicating the increase of the reversibility of oxygen redox, which is beneficial for the electrochemical performance of the material. The charge and discharge properties are measured using galvanostatic charge and discharge at 10 mA/g as shown in Fig. 4(b). The first charge capacity of LNTMO-F0 is 222.1 mA$\cdot$h$\cdot$g$^{-1}$, including the oxidation of Ni$^{2+}$ to Ni$^{3+}$/Ni$^{4+}$ oxidation below 4.5 V and oxygen oxidation process over 4.5 V.[11] The first discharge capacity of LNTMO-F0 is 204.1 mA$\cdot$h$\cdot$g$^{-1}$. While the first charge and discharge capacities of LNTMO-F15 are 244.5 mA$\cdot$h$\cdot$g$^{-1}$ and 250.9 mA$\cdot$h$\cdot$g$^{-1}$, respectively. The initial reversible capacity is significantly improved by fluorine substitution, owning to the increase of redox capacity below 4.5 V. Thus, the F-substitution may mainly increase the cation redox in the samples due to the increased Ni content. The cycle performance is also improved by fluorine substitution. LNTMO-F15 shows the highest capacity in the first cycle and capacity retention (46%) after 20 cycles. Figure 4(d) shows the rate capability of LNTMO-F0, LNTMO-F15. The LNTMO-F15 sample shows a better rate capability than LNTMO-F0. As current densities increase from 20 mA/g to 200 mA/g, the discharge capacities decrease from 122.9 mA$\cdot$h$\cdot$g$^{-1}$, 151.8 mA$\cdot$h$\cdot$g$^{-1}$ to 6.8 mA$\cdot$h$\cdot$g$^{-1}$, 48.7 mA$\cdot$h$\cdot$g$^{-1}$ in LNTMO-F0 and LNTMO-F15, respectively.
cpl-38-8-088201-fig4.png
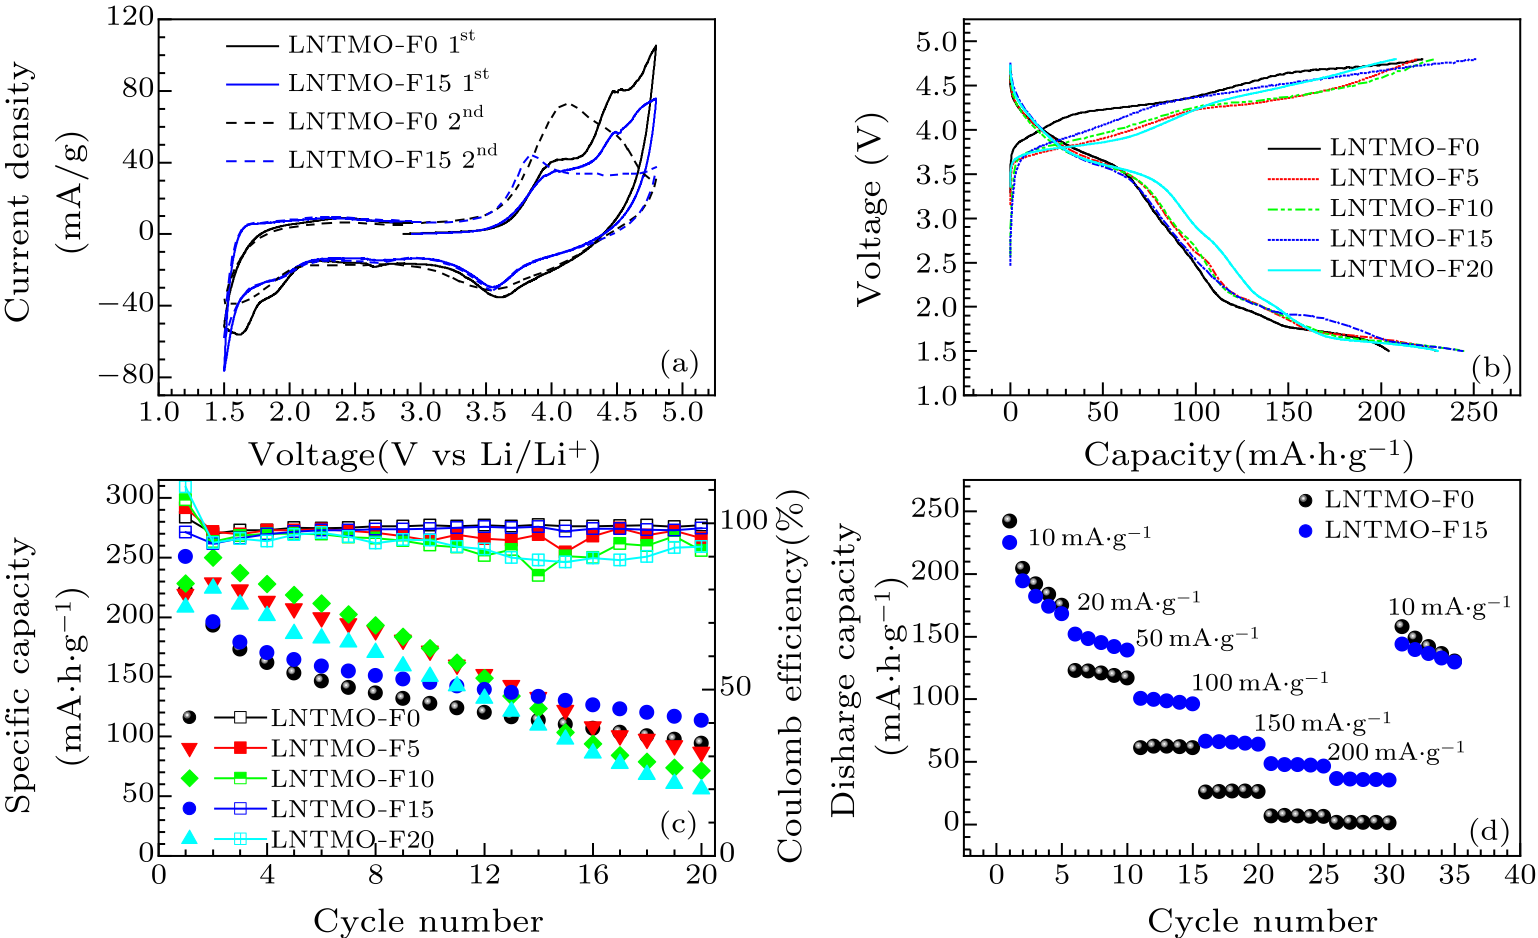
Fig. 4. (a) Cyclic voltammograms for the first two scans of Li$_{1.14}$Ni$_{0.57+0.5 x}$Ti$_{0.19-0.5 x}$Mo$_{0.10}$O$_{2-x}$F$_{x}$ ($x=0,\, 0.15$), with a scan rate of 0.1 mV/s. (b) Galvanostatic charge and discharge curves for the first cycle of Li$_{1.14}$Ni$_{0.57+0.5 x}$Ti$_{0.19-0.5 x}$Mo$_{0.10}$O$_{2-x}$F$_{x}$ ($x=0,\, 0.05,\, 0.10,\, 0.15$, and 0.20) within the voltage window of 1.5–4.8 V at 10 mA/g. (c) The capacity retention plots. (d) Rate capability of Li$_{1.14}$Ni$_{0.57+0.5 x}$Ti$_{0.19-0.5 x}$Mo$_{0.10}$O$_{2-x}$F$_{x}$ ($x=0,\, 0.15$).
cpl-38-8-088201-fig5.png
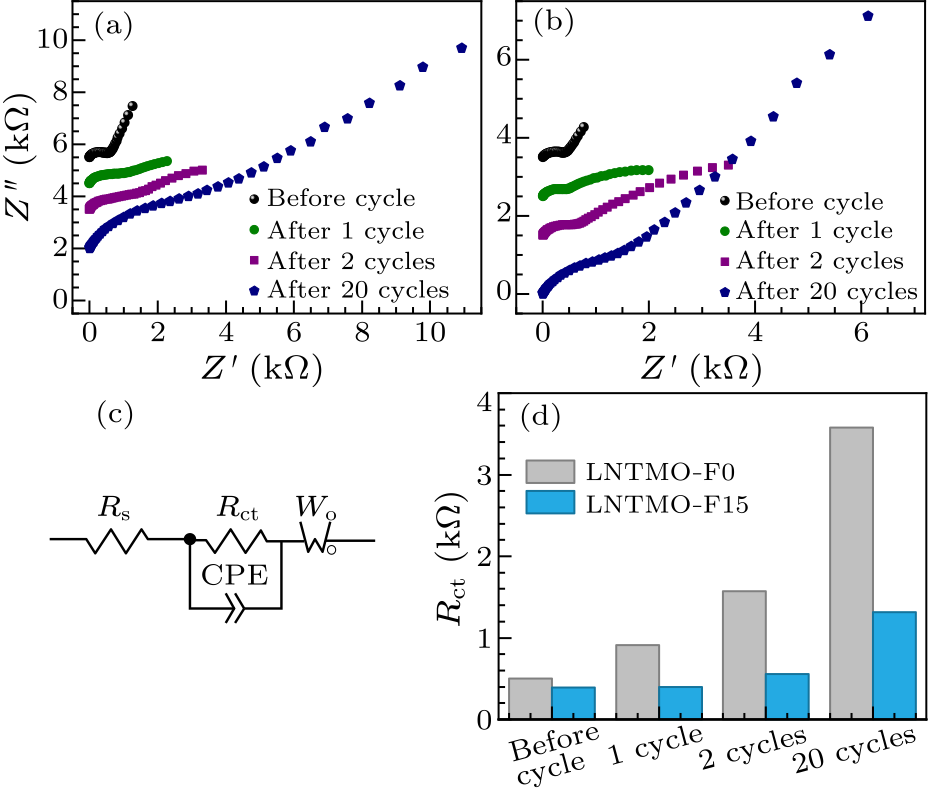
Fig. 5. Nyquist plots at different cycles of (a) Li$_{1.14}$Ni$_{0.57+0.5 x}$Ti$_{0.19-0.5 x}$Mo$_{0.10}$O$_{2-x}$F$_{x}$ ($x=0$), (b) Li$_{1.14}$Ni$_{0.57+0.5 x}$Ti$_{0.19-0.5 x}$Mo$_{0.10}$O$_{2-x}$F$_{x}$ ($x=0.15$). (c) Equivalent circuit model of Li$_{1.14}$Ni$_{0.57+0.5 x}$Ti$_{0.19-0.5 x}$Mo$_{0.10}$O$_{2-x}$F$_{x}$ ($x=0,\, 0.15$). The parameters $R_{\rm s}$ and $R_{\rm ct}$ refer to the ohm resistance and the charge transfer resistance, while $C_{\rm PE}$ and $W_{\rm o}$ correspond to the constant phase-angle element and the Warburg impedance, respectively. (d) Evaluated impedance parameters of $R_{\rm ct}$.
The Nyquist plots of half cells with LNTMO-F0 and LNTMO-F15 as the cathode at different states are shown in Fig. 5. The plots include a semicircle at high frequency and a straight line at low frequency, which correspond to the charge transfer resistance and the Warburg diffusion impedance, respectively.[52] An equivalent circuit is shown Fig. 5(c).[53] The calculated results of $R_{\rm ct}$ are shown in Fig. 5(d). The $R_{\rm ct}$ of LNTMO-F0 increases significantly after the first cycle, and the $R_{\rm ct}$ continues to increase in the following cycles. The high-voltage charge process could cause side reactions between the electrolyte and the highly oxidized transition metal in the charged electrode, increasing the impedance. In addition, oxygen oxidizes under high voltage, and highly oxidized oxygen may further catalyze electrolyte decomposition. This side reaction leads to degradation of the surface of the electrolyte and active materials, the formation of by-products, and affects the diffusion of lithium ions. It is obvious that LNTMO-F15 shows less $R_{\rm ct}$ value, which demonstrates a better lithium-ion transmission capability, and is consistent with better cycle and rate performance. Thus, F-substitution mitigates a side reaction caused by charging to a high voltage. After cycles, the $R_{\rm ct}$ of LNTMO-F15 is smaller than that of LNTMO-F0, indicating that F-substitution can promote the transfer of charge, and to a certain extent alleviate the increasing trend of the charge transfer resistance of the LNTMO-F15 electrode.[54] To study the effect of F-substitution on the electrochemical redox reaction, Ni $2p$, O $1s$ and F $1s$ spectroscopies of LNTMO-F0 and LNTMO-F15 electrodes at different states were characterized by XPS in Fig. 6. Core-level binding energies were determined using a C $1s$ peak at 284.8 eV as the charge reference.[55] In the Ni $2p$ [Figs. 6(a) and 6(b)] spectrum, the peak at 855.7 eV is the typical peak position of Ni$^{2+}$ $2p_{3/2}$ in nickel oxide materials, and the peak at 873.5 eV corresponds to Ni$^{2+}$ $2p_{1/2}$, accompanied by Ni$^{3+}$ $2p_{3/2}$ peak at 857.1 eV.[48] The peak of Ni$^{2+}$ shifts to the direction of a high binding energy, demonstrating that nickel is oxidized.[50] When charging to 4.8 V, a new peak is formed at a higher binding energy position (858.2 eV), and it can be considered as the peak of Ni$^{4+}$ species.[48] Therefore, it is concluded that during the first charging, Ni$^{2+}$ ions are oxidized to Ni$^{3+}$/Ni$^{4+}$.
cpl-38-8-088201-fig6.png
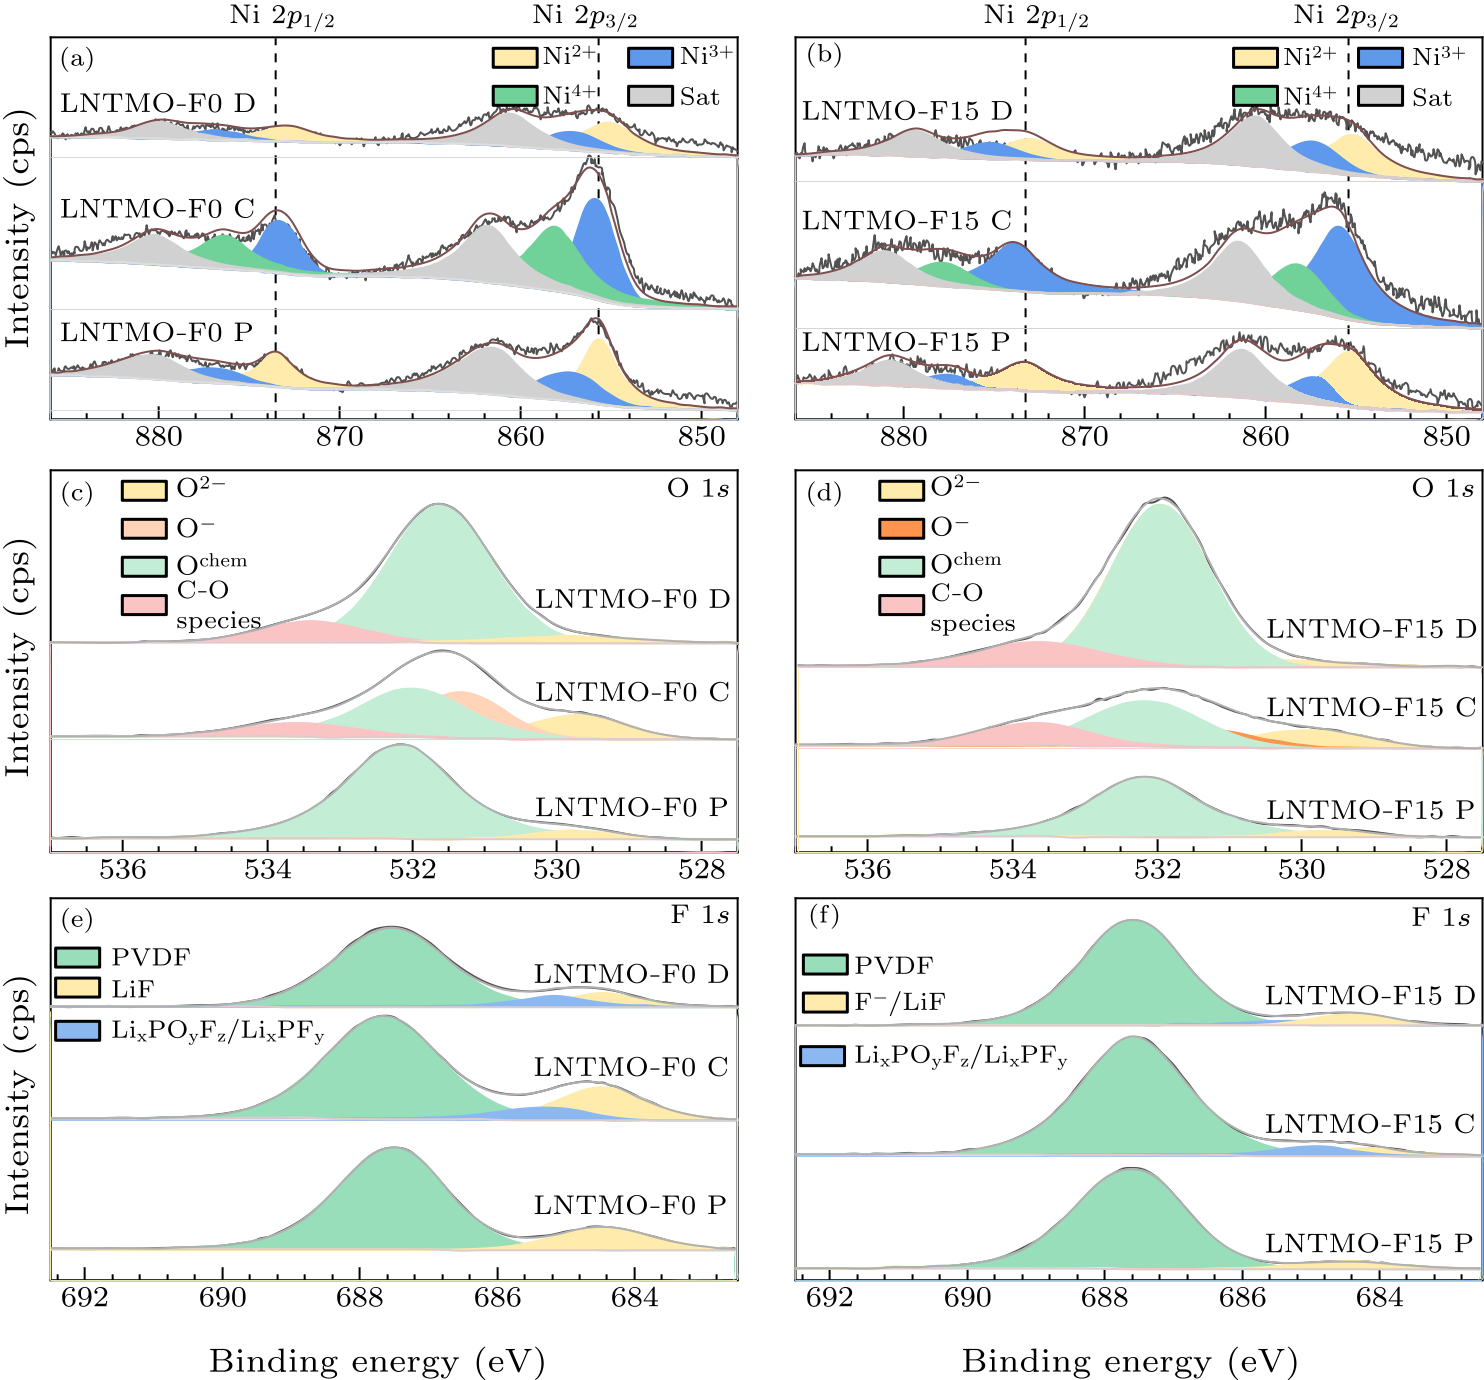
Fig. 6. x-ray photoelectron spectroscopy of the pristine, first charged and first discharged of Li$_{1.14}$Ni$_{0.57+0.5 x}$Ti$_{0.19-0.5 x}$Mo$_{0.10}$O$_{2- x}$F$_{x}$ ($x=0,\, 0.15$) electrode: [(a), (b)] nickel $2p$, [(c), (d)] oxygen $1s$, [(e), (f)] fluorine $1s$.
After the discharge, the characteristic peak shifts to the direction of low binding energy. LNTMO-F15 can basically return to the original position, revealing the reversible reduction of high-valent nickel, while the characteristic peak of Ni $2p_{3/2}$ in LNTMO-F0 shows a small shift to higher energy after the initial cycle. Regarding the O $1s$, the peak around 529.5 eV [Figs. 6(c) and 6(d)] corresponds to lattice oxygen, and the peak around 532.1 eV corresponds to oxygen in compounds such as nickel oxide.[56,57] During the charging process, the peak of O$^{-}$ appears at 531.4 eV, verifying the oxidation of oxygen.[48,57] When charged to 4.8 V, the area ratio of the peak for O$^{-}$ of LNTMO-F15 is smaller than that of LNTMO-F0, which clarifies that redox is less dependent on oxygen. After first discharge, the energy shift of oxygen binding of LNTMO-F15 is less than that of LNTMO-F0, indicating that the irreversible oxygen loss is suppressed, and the stability of oxygen is improved. The peak at 534 eV is represented by oxide deposits on the surface, such as Li$_{2}$CO$_{3}$.[58] After doping with fluorine, the area ratio of the peak at 534 eV decreases, which indicates that the decomposition of the electrolyte is suppressed. As shown by the F $1s$ spectra [Figs. 6(e)–6(f)], the peak at 687.6 eV corresponds to PVDF, the peak at 685.6 eV corresponds to Li$_{x}$PO$_{y}$F$_{z}$ or Li$_{x}$PF$_{y}$, and the peak at 684.5 eV corresponds to LiF or the F$^{-}$ of LNTMO-F15.[59] LiF signal detected in the pristine samples may result from the reaction of the electrode with hydrofluoric acid, which comes from the dehydrogenation reaction in the PVDF binder catalyzed by the small amount of alkali in the composite slurry.[60] Li$_{x}$PO$_{y}$F$_{z}$ or Li$_{x}$PF$_{y}$ are the by-products of LiPF$_{6}$ hydrolysis.[59] The Li$_{x}$PO$_{y}$F$_{z}$ or Li$_{x}$PF$_{y}$ peaks of the LNTMO-F15 electrode were significantly reduced, further confirming that the formation of the SEI was effectively suppressed by fluorine substitution. The valances of Mo and Ti remain $+$6 and $+$4 during the first cycle for both LNTMO-F0 and LNTMO-F15, as shown in Fig. S5. The highest chemical state of $d^{0}$ transition metals is beneficial to the structure stability during cycles. In situ XRD experiments with Al foil (with diffraction peaks at 2$\theta = 38.47 ^{\circ}$, 44.72$^{\circ}$) as the x-ray window show the structural evolution of LNTMO-F0 and LNTMO-F15 during the first cycle (Fig. 7). The peaks deviate to higher angles and broadening until the fully oxidized state is reached. The position shift of (101)$_{\rm L}$ peak at 36.26$^{\circ}$ for LNTMO-F15 is 0.1834$^{\circ}$ after the first charge, which is less than that for LNTMO-F0 (0.2602$^{\circ}$). The (104)$_{\rm L}$ peak at 43.94$^{\circ}$ shifts to a higher degree by 0.2358$^{\circ}$ for LNTMO-F15 after charging to 4.8 V, which is also less than that for LNTMO-F0 (0.6812$^{\circ}$). The shift to higher degree of the peak position verifies that the lattice parameter decreases during the charging, which is due to the oxidation of nickel and oxygen for both samples, since the ionic radius of Ni$^{3+}$ ($r= 0.56$ Å) and Ni$^{4+}$ ($r= 0.48$ Å) are smaller than that of Ni$^{2+}$ ($r= 0.69$ Å), and the ionic radius of O$^{-}$ is smaller than O$^{2-}$.[19,61] After fluorine doping, the degree of crystal volume change becomes smaller, as shown in Fig. 7(b). During discharge, the peak gradually converts back to its initial angular position while being still slightly broader. The peak position of (104)$_{\rm L}$ is smaller than the pristine state when discharged to 1.5 V. The position shifts to a lower degree by 0.0262$^{\circ}$ for LNTMO-F15 (0.1834$^{\circ}$ for LNTMO-F0), revealing that the degree of lattice expansion during discharge is mitigated. Since the introduction of fluorine reduces the redox of oxygen and inhibits the degradation of the surface structure such as structural amorphization and void formation.[37,62] In addition, the degree of structural change of the rock-salt phase is less than that of the layered phase. For example, the position shift of (200)$_{\rm R}$ peak at 43.64$^{\circ}$ for the LNTMO-F0 sample ($\Delta 1= 0.0786 ^{\circ}$ for the first charge and $\Delta 2= 0.0262 ^{\circ}$ for the first discharge) is less than the position shift of the (104)$_{\rm L}$ peak. The structure of the rock-salt phase is more stable during charge and discharge. All these results show that after fluorine substitution, the degree of lattice expansion is suppressed, and the structural stability is improved.
cpl-38-8-088201-fig7.png
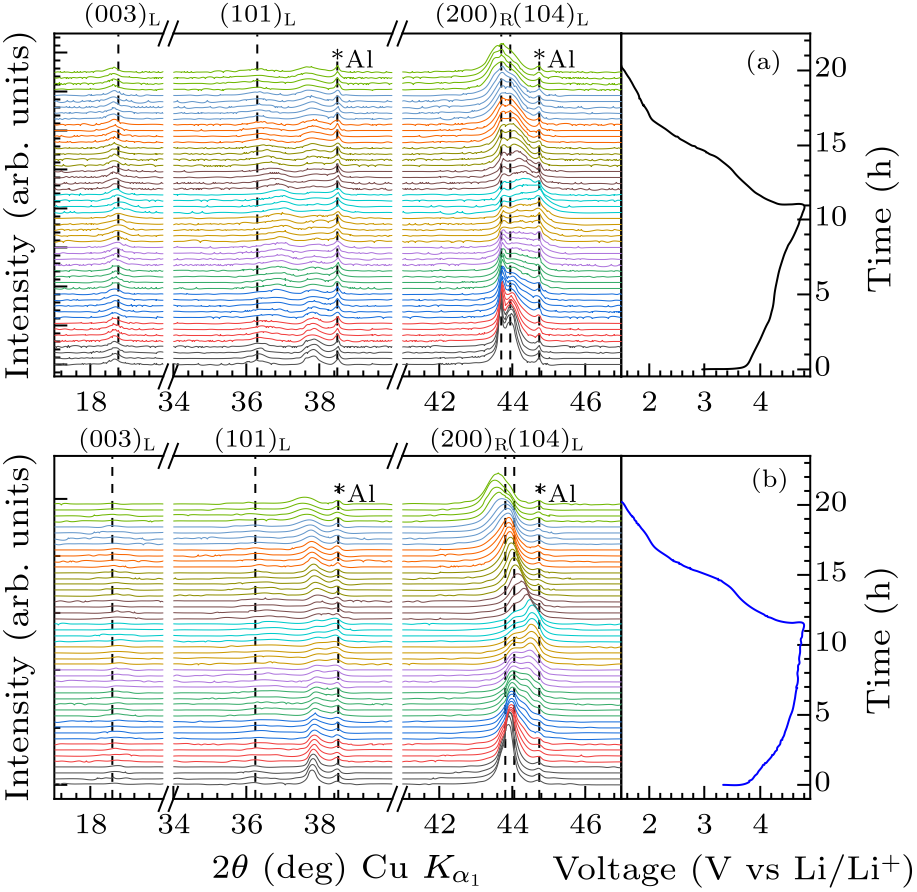
Fig. 7. In situ XRD patterns for the initial cycle of (a) Li$_{1.14}$Ni$_{0.57+0.5 x}$Ti$_{0.19-0.5 x}$Mo$_{0.10}$O$_{2-x}$F$_{x}$ ($x=0$), (b) Li$_{1.14}$Ni$_{0.57+0.5 x}$Ti$_{0.19-0.5 x}$Mo$_{0.10}$O$_{2-x}$F$_{x}$ ($x=0.15$) with the corresponding voltage profile.
cpl-38-8-088201-fig8.png
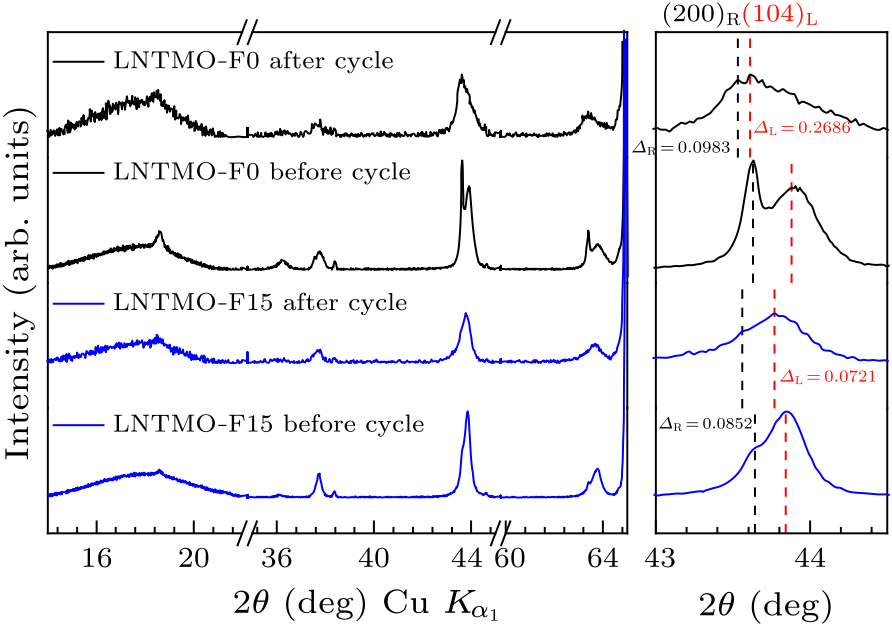
Fig. 8. Ex situ XRD patterns of Li$_{1.14}$Ni$_{0.57+0.5 x}$Ti$_{0.19-0.5 x}$Mo$_{0.10}$O$_{2-x}$F$_{x}$ ($x=0,\, 0.15$) before cycle and after 20 cycles.
Figure 8 shows the ex situ XRD patterns of LNTMO-F0 and LNTMO-F15 before cycle and after 20 cycles, confirming that F-substitution is in favor of structural stability of the electrode during cycle. The peak position of (200)$_{\rm R}$ at 43.64$^{\circ}$ shifts to a lower angle by 0.0983$^{\circ}$ of LNTMO-F0 and 0.0852$^{\circ}$ of LNTMO-F15. After 20 cycles, the position of (104)$_{\rm L}$ peak shifts to a low angle by 0.2686$^{\circ}$ of LNTMO-F0, while it shifts to a low angle only by 0.0721$^{\circ}$ of LNTMO-F15. The peak position shift of LNTMO-F15 is smaller than LNTMO-F0 after 20 cycles, revealing that F$^{-}$ substituted materials have enhanced structural stability during cycle process. The (104)$_{\rm L}$ peak shifts to a lower degree for LNTMO-F15 and LNTMO-F0 after 20 cycles because of the destruction of layer structure.[63,64] It is worth noting that the position shift of the rock-salt phase after cycling is significantly smaller than that of the layered phase, unveiling that the structure of the rock-salt phase is more stable during cycling. In summary, we have investigated the fluorine substitution effect on the electrochemical performance and structural stability improvement of cation-disordered cathode materials. XPS and electrochemical tests prove that fluorine doping suppresses irreversible oxygen loss and reduces the average cation valence, increasing the contribution to the capacity caused by the transition metal redox. Thus, the rate performance and cycle performance of the material are improved. In situ XRD and ex situ XRD results demonstrate that fluorine doping strategy also mitigates structural deformation during the charge/discharge process. In short, as a modification method, fluorine doping can effectively reduce oxygen loss and improve structural stability, improving the electrochemical performance of the material.
References The Birth of the Lithium-Ion BatteryNa 2 Ni 2 TeO 6 : Evaluation as a cathode for sodium batteryThe Li-Ion Rechargeable Battery: A PerspectiveMetastable and nanosize cation-disordered rocksalt-type oxides: revisit of stoichiometric LiMnO 2 and NaMnO 2A reflection on lithium-ion battery cathode chemistryApproaching the capacity limit of lithium cobalt oxide in lithium ion batteries via lanthanum and aluminium dopingNickel-Rich and Lithium-Rich Layered Oxide Cathodes: Progress and PerspectivesLithium Batteries and Cathode MaterialsPolyanionic (Phosphates, Silicates, Sulfates) Frameworks as Electrode Materials for Rechargeable Li (or Na) BatteriesPerformance and design considerations for lithium excess layered oxide positive electrode materials for lithium ion batteriesA new class of high capacity cation-disordered oxides for rechargeable lithium batteries: Li–Ni–Ti–Mo oxidesSuppression of O-redox reactions by multivalent Cr in Li-excess Li 2.4 M 0.8 M 0.8 O4 (M, M’ = Cr, Mn, and Ti) cathodes with layered and cation-disordered rock-salt structuresMultishelled Ni-Rich Li(Ni x Co y Mn z )O 2 Hollow Fibers with Low Cation Mixing as High-Performance Cathode Materials for Li-Ion BatteriesMinimization of the cation mixing in Li1+x(NMC)1−xO2 as cathode materialUnlocking the Potential of Cation-Disordered Oxides for Rechargeable Lithium BatteriesCation-disordered rocksalt transition metal oxides and oxyfluorides for high energy lithium-ion cathodesThe Configurational Space of Rocksalt-Type Oxides for High-Capacity Lithium Battery ElectrodesDesign Principles for High-Capacity Mn-Based Cation-Disordered Rocksalt CathodesStructural and mechanistic revelations on high capacity cation-disordered Li-rich oxides for rechargeable Li-ion batteriesMaterial Design Concept of Lithium‐Excess Electrode Materials with Rocksalt‐Related Structures for Rechargeable Non‐Aqueous BatteriesReversible Li storage for nanosize cation/anion-disordered rocksalt-type oxyfluorides: LiMoO 2 – x LiF (0 ≤ x ≤ 2) binary systemSynthesis and Electrochemical Properties of Li 4 MoO 5 –NiO Binary System as Positive Electrode Materials for Rechargeable Lithium BatteriesHigh-capacity electrode materials for rechargeable lithium batteries: Li 3 NbO 4 -based system with cation-disordered rocksalt structureOrigin of stabilization and destabilization in solid-state redox reaction of oxide ions for lithium-ion batteriesReversible Three-Electron Redox Reaction of Mo 3+ /Mo 6+ for Rechargeable Lithium BatteriesLithium-Excess Cation-Disordered Rocksalt-Type Oxide with Nanoscale Phase Segregation: Li 1.25 Nb 0.25 V 0.5 O 2Designing New Lithium-Excess Cathode Materials from Percolation Theory: Nanohighways in Li x Ni 2–4 x /3 Sb x /3 O 2Characterization of Disordered Li (1+ x ) Ti 2 x Fe (1–3 x ) O 2 as Positive Electrode Materials in Li-Ion Batteries Using Percolation TheoryDesign principles for high transition metal capacity in disordered rocksalt Li-ion cathodesA disordered rock-salt Li-excess cathode material with high capacity and substantial oxygen redox activity: Li 1.25 Nb 0.25 Mn 0.5 O 2Graphene-based surface modification on layered Li-rich cathode for high-performance Li-ion batteriesCation disordered rock salt phase Li2CoTiO4 as a potential cathode material for Li-ion batteriesShort-Range Order and Unusual Modes of Nickel Redox in a Fluorine-Substituted Disordered Rocksalt Oxide Lithium-Ion CathodeMitigating oxygen loss to improve the cycling performance of high capacity cation-disordered cathode materialsAnion Reactivity in Cation‐Disordered Rocksalt Cathode Materials: The Influence of Fluorine SubstitutionSuppressing Mn Reduction of Li-Rich Mn-Based Cathodes by F-Doping for Advanced Lithium-Ion BatteriesA Fluorination Method for Improving Cation‐Disordered Rocksalt Cathode PerformanceFluorination effect for stabilizing cationic and anionic redox activities in cation-disordered cathode materialsReversible Mn2+/Mn4+ double redox in lithium-excess cathode materialsHigh capacity Li/Ni rich Ni-Ti-Mo oxide cathode for Li-ion batteriesA new model on cation distribution in cation-disordered Li1+xTM1−xO2 cathodesPerformance of layered Li(Ni1/3Co1/3Mn1/3)O2 as cathode for Li-ion batteriesA comparison of high voltage outgassing of LiCoO2, LiNiO2, and Li2MnO3 layered Li-ion cathode materialsElectrochemical and in-situ XRD characterization of LiNiO2 and LiCo0.2Ni0.8O2 electrodes for rechargeable lithium cellsRevised effective ionic radii and systematic studies of interatomic distances in halides and chalcogenidesAttainable high capacity in Li-excess Li-Ni-Ru-O rock-salt cathode for lithium ion batterySynthesis and investigation of electrochemical performance of mixed valent Li4FeMoO6 as positive electrode material in rechargeable lithium ion batteriesSynthesis and Redox Mechanism of Cation-Disordered, Rock-Salt Cathode-Material Li–Ni–Ti–Nb–O Compounds for a Li-Ion BatterySynthesis and electrochemistry of cubic rocksalt Li–Ni–Ti–O compounds in the phase diagram of LiNiO2–LiTiO2–Li[Li1/3Ti2/3]O2Electrochemistry and redox characterization of rock-salt-type lithium metal oxides Li1+z/3Ni1/2-z/2Ti1/2+z/6O2 for Li-ion batteriesFacile Synthesis of The Li-Rich Layered Oxide Li 1.23 Ni 0.09 Co 0.12 Mn 0.56 O 2 with Superior Lithium Storage Performance and New Insights into Structural Transformation of the Layered Oxide Material during Charge–Discharge Cycle: In Situ XRD CharacterizationSelf-Assembled Synthesis of Hierarchical Waferlike Porous Li–V–O Composites as Cathode Materials for Lithium Ion BatteriesSurface modification of Li rich Li1.2Mn0.54Ni0.13Co0.13O2 cathode particlesEditors' Choice—Practical Assessment of Anionic Redox in Li-Rich Layered Oxide Cathodes: A Mixed Blessing for High Energy Li-Ion BatteriesStabilization of Li-Rich Disordered Rocksalt Oxyfluoride Cathodes by Particle Surface ModificationElectrochemical performance of high-capacity nanostructured Li[Li0.2Mn0.54Ni0.13Co0.13]O2 cathode material for lithium ion battery by hydrothermal methodCation-Disordered Lithium-Excess Li–Fe–Ti Oxide Cathode Materials for Enhanced Li-Ion StorageInsights into Boron-Based Polyanion-Tuned High-Nickel Cathodes for High-Energy-Density Lithium-Ion BatteriesXPS-Surface Analysis of SEI Layers on Li-Ion Cathodes: Part II. SEI-Composition and Formation inside Composite ElectrodesSurface Characterization of Electrodes from High Power Lithium-Ion BatteriesMn 4+ -Substituted Li-Rich Li 1.2 Mn 0.4 3+ Mn x 4+ Ti 0.4– x O 2 Materials with High Energy DensityFluorination‐Enhanced Surface Stability of Cation‐Disordered Rocksalt Cathodes for Li‐Ion BatteriesMagnesium-doped Li[Li0.2Mn0.54Ni0.13Co0.13]O2 cathode with high rate capability and improved cyclic stabilityA comprehensive study on electrochemical performance of Mn-surface-modified LiNi0.8Co0.15Al0.05O2 synthesized by an in situ oxidizing-coating method
[1] Yoshino A 2012 Angew. Chem. Int. Ed. Engl. 51 5798
[2] Gupta A, Mullins C B, and Goodenough J B 2013 J. Power Sources 243 817
[3] Goodenough J B and Park K S 2013 J. Am. Chem. Soc. 135 1167
[4] Sato T et al. 2018 J. Mater. Chem. A 6 13943
[5] Manthiram A 2020 Nat. Commun. 11 1550
[6] Liu Q et al. 2018 Nat. Energy 3 936
[7] Manthiram A et al. 2016 Adv. Energy Mater. 6 1501010
[8] Whittingham M S 2004 Chem. Rev. 104 4271
[9] Masquelier C and Croguennec L 2013 Chem. Rev. 113 6552
[10] Hy S et al. 2016 Energy & Environ. Sci. 9 1931
[11] Lee J et al. 2015 Energy & Environ. Sci. 8 3255
[12] Hamaguchi M et al. 2020 Electrochim. Acta 354 136630
[13] Zou Y et al. 2017 Adv. Sci. 4 1600262
[14] Zhang X et al. 2010 J. Power Sources 195 1292
[15] Lee J et al. 2014 Science 343 519
[16] Clément R J, Lun Z, and Ceder G 2020 Energy & Environ. Sci. 13 345
[17] Urban A, Lee J, and Ceder G 2014 Adv. Energy Mater. 4 1400478
[18] Lun Z et al. 2020 Chem 6 153
[19] Zhao E et al. 2019 Energy Storage Mater. 16 354
[20] Yabuuchi N 2019 Chem. Rec. 19 690
[21] Takeda N et al. 2017 J. Power Sources 367 122
[22] Yabuuchi N et al. 2016 Chem. Mater. 28 416
[23] Yabuuchi N et al. 2015 Proc. Natl. Acad. Sci. USA 112 7650
[24] Yabuuchi N et al. 2016 Nat. Commun. 7 13814
[25] Hoshino S et al. 2017 ACS Energy Lett. 2 733
[26] Nakajima M and Yabuuchi N 2017 Chem. Mater. 29 6927
[27] Twu N et al. 2015 Nano Lett. 15 596
[28] Glazier S L et al. 2015 Chem. Mater. 27 7751
[29] Kitchaev D A et al. 2018 Energy & Environ. Sci. 11 2159
[30] Wang R et al. 2015 Electrochem. Commun. 60 70
[31] Song B et al. 2013 J. Mater. Chem. A 1 9954
[32] Yang M et al. 2012 J. Mater. Chem. 22 6200
[33] Clément R J et al. 2018 Chem. Mater. 30 6945
[34] Lee J et al. 2017 Nat. Commun. 8 981
[35] Crafton M J et al. 2020 Adv. Energy Mater. 10 2001500
[36] Wang Y et al. 2018 J. Phys. Chem. C 122 27836
[37] Ahn J, Chen D, and Chen G 2020 Adv. Energy Mater. 10 2001671
[38] Zhou K et al. 2020 Energy Storage Mater. 32 234
[39] Lee J et al. 2018 Nature 556 185
[40] Xu J et al. 2020 Solid State Ionics 345 115172
[41] Huang Y et al. 2020 Solid State Ionics 351 115341
[42] Shaju K M, Rao G V S, and Chowdari B V R 2002 Electrochim. Acta 48 145
[43] Papp J K et al. 2021 Electrochim. Acta 368 137505
[44] Levi E et al. 1999 Solid State Ionics 126 97
[45] Shannon R D 1976 Acta Cryst. A 32 751
[46] Wang X et al. 2017 J. Power Sources 359 270
[47] Babu D B et al. 2019 J. Power Sources 436 226870
[48] Yu Z et al. 2019 ACS Appl. Mater. & Interfaces 11 35777
[49] Zhang L et al. 2008 J. Power Sources 185 534
[50] Zheng S et al. 2019 J. Alloys Compd. 773 1
[51] Shen C H et al. 2014 ACS Appl. Mater. & Interfaces 6 5516
[52] Qiao Y Q et al. 2011 J. Phys. Chem. C 115 25508
[53] Wang Z et al. 2019 Ceram. Int. 45 20016
[54] Assat G et al. 2016 J. Electrochem. Soc. 163 A2965
[55] Naylor A J et al. 2020 ACS Appl. Energy Mater. 3 5937
[56] Wei X et al. 2013 Electrochim. Acta 107 549
[57] Yang M et al. 2019 ACS Appl. Mater. & Interfaces 11 44144
[58] Xie Q et al. 2019 Chem. Mater. 31 8886
[59] Schulz N et al. 2018 J. Electrochem. Soc. 165 A833
[60] Andersson D P A A M et al. 2002 J. Electrochem. Soc. 149 A1358
[61] Zheng S et al. 2020 ACS Appl. Mater. & Interfaces 12 40347
[62] Li L et al. 2021 Adv. Funct. Mater. 31 2101888
[63] Meng F et al. 2019 Ionics 25 1967
[64] Huang B et al. 2014 J. Power Sources 252 200