Chinese Physics Letters, 2019, Vol. 36, No. 9, Article code 098201Express Letter Lithium Storage Property of Graphite/AlCuFe Quasicrystal Composites Haijuan Wang (王海娟), Xiao Lan (兰枭), Yao Huang (黄耀), Xunyong Jiang (姜训勇)** Affiliations Key Laboratory of Display Materials and Photoelectric Devices (Ministry of Education), Tianjin Key Laboratory for Photoelectric Materials and Devices, National Demonstration Center for Experimental Function Materials, and School of Materials Science and Engineering, Tianjin University of Technology, Tianjin 300191 Received 18 July 2019, online 05 August 2019 **Corresponding author. Email: jiangxunyong@tjut.edu.cn Citation Text: Wang H J, Lan X, Huang Y and Jiang X Y 2019 Chin. Phys. Lett. 36 098201    Abstract Quasicrystals have long-range quasi-periodic translational ordering and non-crystallographic rotational symmetry. Al–Cu–Fe quasicrystals have great potential for lithium storage because of their high Al content and a large number of defects in the structure. In our previous study (J. Alloys Compd. 805 (2019) 942) we showed that Al–Cu–Fe quasicrystals have good initial capacity whereas its cycle stability is poor. In the present study, graphite/AlCuFe is prepared by the mechanical alloying method. The results show that graphite/AlCuFe quasicrystal composites are successfully synthesized by planetary ball milling at 550 rpm for 80 h. The quasicrystal particle size decreases and the amorphous graphite forms onion-like carbon (OLC) when the two phases mix evenly. OLC forms on the surface of the Al–Cu–Fe quasicrystalline powder. Charge and discharge tests show that graphite/AlCuFe quasicrystal composites have high-stability capacity of 480 mAh/g after 20 cycles, which is larger than the sum of capacities of graphite and Al–Cu–Fe quasicrystals. DOI:10.1088/0256-307X/36/9/098201 PACS:82.47.Aa, 71.23.Ft, 81.20.Ev, 82.45.Fk © 2019 Chinese Physics Society Article Text Rechargeable lithium-ion batteries (LIBs) are currently preferred energy storage devices in portable electronic devices with high energy density, good cycle life and good power performance.[1,2] The energy density of current LIBs can not satisfy the ever-growing demands for electric vehicles (EVs), portable electronics and large-scale renewable energy storage.[3] Commercial graphite anodes exhibit only moderate intrinsic specific capacity (372 mAh/g). It is important to develop safe and low-cost electrode materials that can further improve LIB efficiency and cycle life.[4] Al anode material has very rich reserves and suitable lithium intercalation potential.[5] When Li and Al form LiAl alloy, the theoretical specific capacity is 993 mAh/g, which is about three times that of graphite anode. However, in the process of cycling, Al always suffers from rapid capacity attenuation caused by structural degradation and electrical contact loss. To improve the polarization and volume expansion of Al-based anode materials in electrode reaction, one effective measure is to add alloy elements into Al, which will reduce the volume change of the electrode in the process of charging and discharging.[6] Quasicrystals (QCs) have a structure that is ordered but not periodic with 5-fold, or even 8-fold or 10-fold symmetries.[7] The special atomic arrangement of QCs determines its special property. QCs have been used as hydrogen storage materials, such as gas storage and electrochemical hydrogen storage.[8,9] Al–Cu–Fe QCs can be acquired under the cast state. It has high Al content. We found that Al–Cu–Fe QCs can store lithium. The first specific discharge capacities are 204mAh/g, but it will decrease to 65 mAh/g after a stable cycle.[10] In this work, graphite/AlCuFe quasicrystal (QC) composites are prepared by mechanical alloying to improve the capacity stability of the Al–Cu–Fe QC electrode. Graphite can buffer the huge volume change of the Al negative electrode during the charging and discharging processes. On the other hand, it can improve the conductivity of materials and avoid the occurrence of Al particles to reunite in the charging and discharging cycle. The first discharge capacity of the composite material reaches 886 mAh/g and stabilizes at 480 mAh/g after 20 cycles. Compared with QCs, it has a remarkable improvement and good cyclic stability. Graphite/AlCuFe QC composites exhibit the capacity multiplication effect. In our experiment, Al$_{63}$Cu$_{25}$Fe$_{12}$ ingot was prepared by arc melting with Fe (chip 99.9%), Cu (shot 99.9%) and Al (shot 99.9%). The ingot was annealed at 860$^{\circ}\!$C for 4 h under an argon atmosphere. Then it is put into a ball mill to crush into powder. The final particle size was less than 0.0374 mm. Graphite/AlCuFe QC composites were prepared with mechanical alloying with Al–Cu–Fe QC powder and graphite powder with 99.9% purity. Pure-phase Al–Cu–Fe QCs and the graphite material were blended in a weight ratio of 1:1 with a ball-to-powder weight ratio 10:1. The powder was sealed in a stainless steel ball mill during the milling process. The milling process was performed in a planetary ball mill (RE-QM-2SP12) and a high energy vibration ball mill (MSK-SFM-3). High energy vibration ball mill has the characteristics of high input energy, short time and high ball milling efficiency. The input energy of the planetary ball mill is much lower than the high energy vibration ball mill. The structure of the ball-milled powders was examined by Rigaku D/Max-2500V x-ray diffraction (XRD) in the range of 10$^{\circ}$–$90^{\circ}$. LabRAM HR800 laser confocal microscopic Raman spectrometer produced by the Horiba Jobin Yvon company was used to measure the changes of graphite molecular structure during ball milling. The morphology of the samples was analyzed by field emission scanning electron microscopy (SEM) of JSM-6700F. Transmission electron microscopy was performed under a Phillips Tecnai F20 microscope operated at 200 keV. Electrochemical measurements were performed using coin cells, consisting of graphite/Al$_{63}$Cu$_{25}$Fe$_{12}$ composite electrode as the anode, Li metal foil (Honjo Chemical, 99.8%) as the cathode, 1.0 M LiPF$_{6}$ solution as the electrolyte, and a porous polypropylene membrane (Celgard 2400) as the separator. The graphite/Al$_{63}$Cu$_{25}$Fe$_{12}$ composite electrode was prepared on a Cu foil, using a coating of $\alpha$-methyl-2-pyrrolidone as a solvent (NMP, Aldrich), 80 wt.% of active material, 10 wt.% of PVDF as a binder, and 10 wt.% of acetylene black as a conductive material. The resultant electrodes were dried in an oven at 100$^{\circ}\!$C for 12 h. All coin cells were assembled in a high-purity argon-filled glove box with H$_{2}$O and O$_{2}$ contents less than 5 ppm. The discharge-charge test was performed using a Xinwei battery cycle system (CT-3008 W-5V50Ma-S4) in a potential range of 0.02–2.0 V (versus Li/Li$^{+}$ electrode), and the charge and discharge current was 100 mA/g. IM6 electrochemical workstation was utilized to measure electrochemical impedance spectra (EIS) in the frequency range of 110 kHz to 0.01 Hz with ac amplitude 5 mV. Cyclic voltammetry measurements were tested at a scan rate of 0.1 mV/s in the voltage range of 0–3 V (versus Li/Li$^{+}$ electrode). Mechanical alloying were performed with two kinds of apparatus, vibration ball mill, and planetary ball mill. Vibration ball mills have higher input energy compared with planetary ball mill. Figure 1 is the x-ray diffraction analysis of the samples for different grinding times (0 h, 1 h, 2 h, 3 h, 5 h, 7 h, 9 h) with high energy vibration ball mill. The initial state (0 h) is the mechanical mixing of graphite and Al$_{63}$Cu$_{25}$Fe$_{12}$ QCs. The high-intensity diffraction peaks at 2$\theta \approx 26^{\circ}$ are the (002) plane of hexagonal graphite. The other low-intensity diffraction peaks are the diffraction peaks of the AlCuFe icosahedral QC phase. During the first two hours of ball milling, the XRD diffraction peaks of hexagonal graphite and QC phases become wider and the peak strength gradually decreases, which indicate that the mixing of the two materials becomes more uniform and the internal stress of ball milling increases as the particle size of the powder decreases. After two hours of grinding, the diffraction peaks of graphite almost disappear, indicating that the carbon materials have tended to be amorphous. However, the structure of QC materials have been destroyed by high energy input. The main products after 3 h ball milling are the mixture of stable beta phase and carbon. Compared with the vibration ball, the energy input of the planetary ball mill is controllable and more smooth and uniform. To make graphite/AlCuFe QC composites without destroying the QC structure, a planetary ball mill is selected. Figure 2 shows the XRD of the samples for different milling times at 550 rpm. When the milling time reaches 60 h, the high-intensity diffraction carbon peak at 26$^{\circ}$ on the left has completely disappeared. At this time, the graphite material has been completely amorphous, and this kind of the carbon material is helpful to alleviate the volume expansion of the material. The diffraction peaks of Al$_{63}$Cu$_{25}$Fe$_{12}$ QCs on the right side are completely preserved without damage, and the curve of 80 h ball milling is also preserved as that of 60 h QCs. From the XRD spectra of the two samples, no new peaks can be observed during ball milling, which indicates that no new and impurity phases can be formed at the same time. With the increase of ball milling time, the grain size decreases. The preparing method of the composite for subsequent electrochemical test is selected as planetary ball milling. The preparation parameter is 550 rpm for 80 h.
cpl-36-9-098201-fig1.png
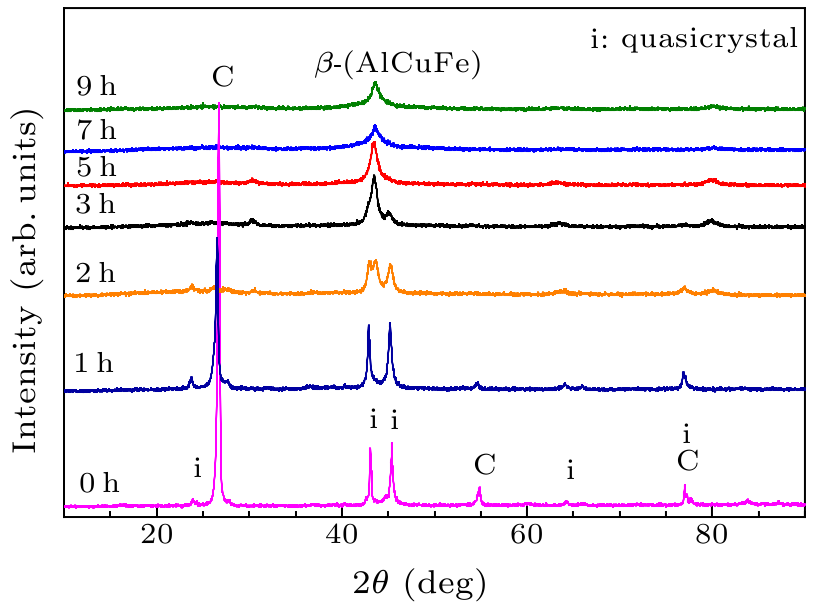
Fig. 1. X-ray diffraction spectra of mixed powders after high energy vibration ball milling at different times.
cpl-36-9-098201-fig2.png
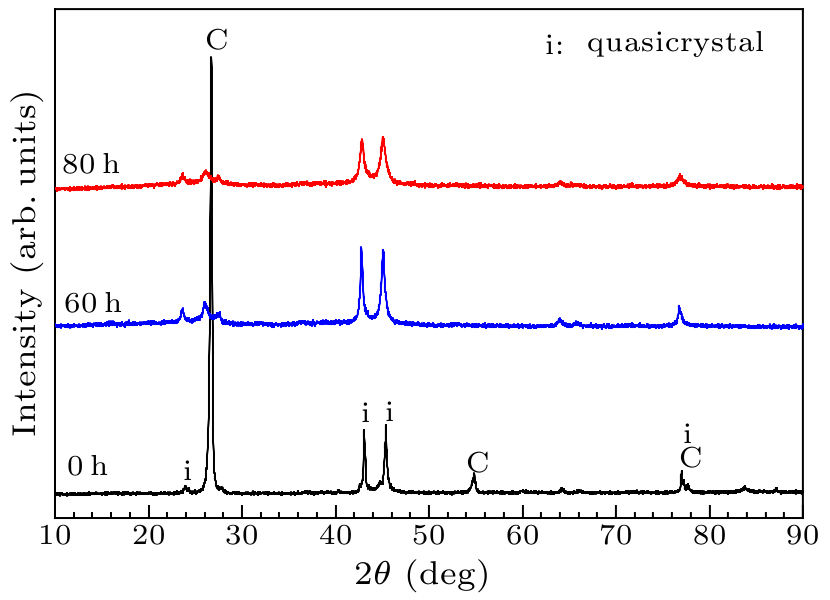
Fig. 2. XRD of planetary milled 550 rpm powders for different milling times.
Figure 3 shows the Raman spectroscopy of the samples with different milling times. The D peak and G peak are located at about 1360 cm$^{-1}$ and 1581 cm$^{-1}$, respectively. The G peak originates from the stretching vibration of $sp^{2}$ bonded carbon atoms in the hexagonal graphite substrate. The D peak is due to the vibration of the hanging bond on the edge of the disordered graphite plane.[11] The broadening of the D peak indicates that the defect caused by mechanical wear has low crystalline carbon, which leads to a disordered carbon layer. In addition, the relative strength of the D and G peaks varies significantly with the grinding time. It shows that mechanical alloying increases the amorphous degree of graphite.
cpl-36-9-098201-fig3.png
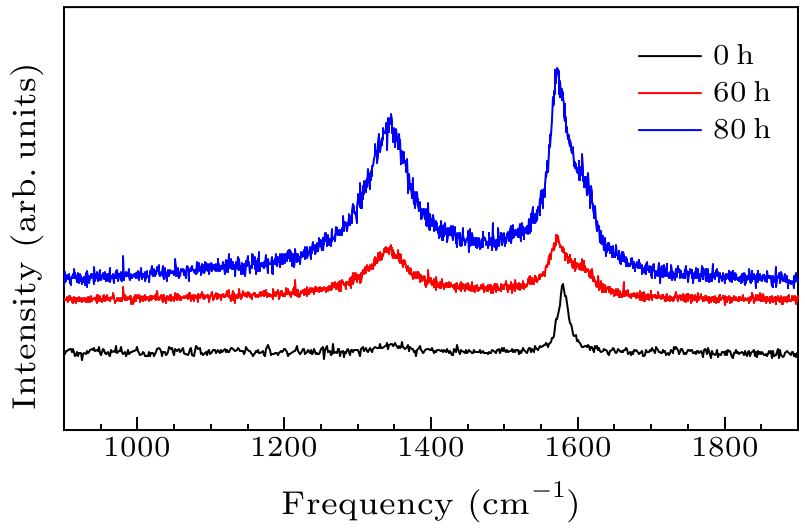
Fig. 3. Raman spectra of graphite milled by planetary ball at 550 rpm at different times.
Figure 4 gives the SEM image of graphite/AlCuFe QCs mixed powders. Figure 4(a) is for the mixture of the initial AlCuFe QCs and graphite. Figure 4(b) is for the sample of Al–Cu–Fe QCs and graphite milled at 550 rpm for 80 h. The large white particles in the initial state are Al$_{63}$Cu$_{25}$Fe$_{12}$ QCs. The size of the surrounding particles is not uniform, and the small irregular particles are graphite powder (Fig. 4(a)). After high energy ball milling, the particle size decreases obviously and the homogeneous distribution of the elements appears (Fig. 4(b)). The QC surface is coated with a carbon layer, there are void defects on the particle surface, and a large amount of carbon is filled in the voids, which makes it possible for more lithium ions to be embedded. At the same time, carbon materials can play a greater role in inhibiting the volume change of the matrix.
cpl-36-9-098201-fig4.png
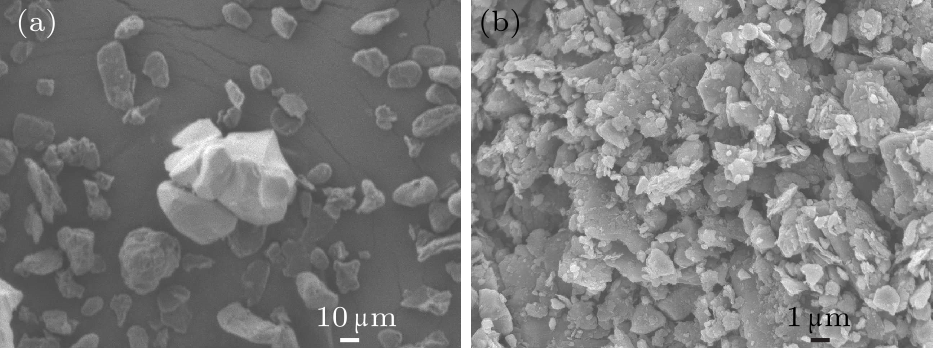
Fig. 4. (a) SEM image of the initial Al–Cu–Fe QCs and graphite mixed powders. (b) SEM image of graphite/AlCuFe QC composites after planetary ball milling for 80 h.
Figure 5 presents the TEM graphs of the composite material prepared after 550 rpm 80 h. Figure 5(a) shows a micrograph of the QC alloy and carbon particles. The size of QC particles (dark part) in the powder is larger ($ < $400 nm) and irregular in shape. They contact with small translucent graphite particles ($\sim$10 nm) with uniform distribution. Figure 5(b) is an enlargement of Fig. 5(a). The remarked differences in the particle size of both types of phases ensure the ability to get good dispersion and homogeneity in the reinforcement material. Figures 5(c) and 5(d) show the high-magnification TEM images of the smaller carbon particles that indicate the presence of onion-like carbon (OLC). The HRTEM images show that the lattice planes with a layer spacing of about 0.33 nm coincide with the lattice spacing of hexagonal graphite (002). OLC particles show highly deformed structures embedded in amorphous carbon materials. This result is consistent with Ref.  [11]. Al–Cu–Fe QCs can cause the formation of OLC. The graphite/AlCuFe QCs prepared by mechanical alloying are OLC-AlCuFe QC composites.
cpl-36-9-098201-fig5.png
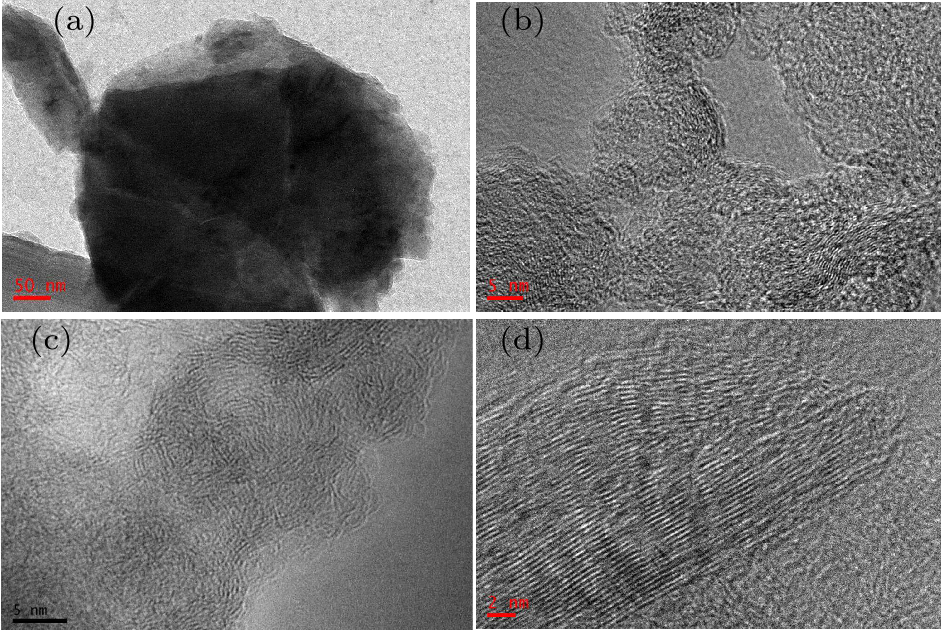
Fig. 5. [(a), (b)] TEM images of graphite/AlCuFe QC composites with different magnifications after planetary ball milling for 80 h. [(c), (d)] HRTEM images of graphite particles with different magnifications.
cpl-36-9-098201-fig6.png
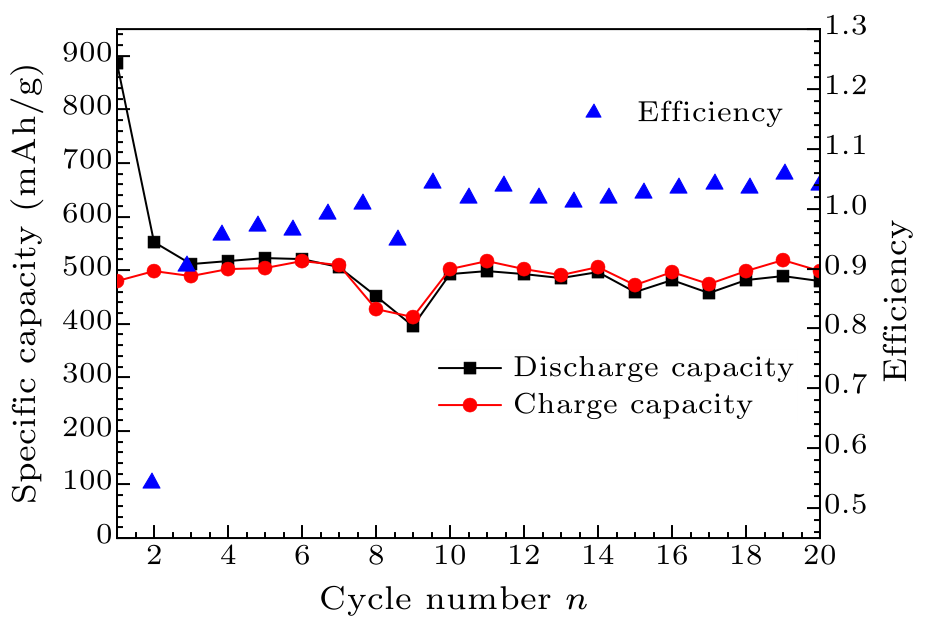
Fig. 6. Cyclic performance curve of graphite/AlCuFe QC composites.
Figure 6 shows the cyclic performance of AlCuFe quasicrystalline composites. It is obvious that the first discharge specific capacity is 886 mAh/g, the first charge specific capacity is 480 mAh/g, and the first cycle efficiency is 54%. The efficiency increases significantly. The aging rate reaches 95% in the third cycle, then the efficiency increases slowly until the seventh cycle, the efficiency reaches 100%, and finally the efficiency remains stable at around 100%. In the first three cycles, the specific capacity of materials obviously decreases relatively. During the charging and discharging cycle, there appears a small fluctuation of capacity. After 10 cycles, the charge-discharge capacity reaches a stable level at about 480 mAh/g. Generally, the cycling performance of the crystalline anode material will be improved after the graphite material is compounded with the crystalline anode material. However, the capacity of composites is lower than the sum of capacities of graphite and silicon. Taking nano-silicon as an example, its initial discharge capacity is 2500 mAh/g. As the cycle progresses, the capacity of Si decreases rapidly.[12] When nano-silicon and carbon are doped, the cyclic properties of the composites are greatly improved. When the mass ratio of nano-silicon to carbon is 1:1 (the atomic ratio is 1:2), the cyclic stability capacity of the composites is 850 mAh/g.[13] The theoretical lithium storage capacity of graphite is 372 mAh/g. The capacity of nano-silicon is determined by its initial discharge capacity. The theoretical estimated capacity of nano-silicon/graphite composites is (372$+$2500)/2 = 1436 mAh/g. The addition of carbon alleviates the volume expansion of Si during charging and discharging, thus improving its cycling performance. The experimental results show that the capacity of Si/C composites is lower than the theoretical estimate (1436 mAh/g) of capacity of composites. The stable capacity of Al–Cu–Fe QCs is 65 mAh/g.[10] The theoretical specific capacity of graphite is 372 mAh/g. The doping mass ratio of the two is 1:1. Then the theoretical estimate of capacity of OLC-AlCuFe QC composites is (65 + 372)/2 = 218.5mAh/g. The final stable specific capacity of the composites is 480 mAh/g, which is over twice the theoretically estimated capacity. Graphite/AlCuFe QC composites exhibit capacity multiplication effect. This phenomenon may come from a special carbon structure on Al–Cu–Fe QC powder. The fullerene coating not only reduces the enormous volume change of Al anode during charge and discharge, but also improves the conductivity of the material and helps to form a stable SEI film. As a result, the specific capacity of graphite/AlCuFe QC composites is higher than the theoretical estimate. Figure 7 shows the voltage between the graphite/AlCuFe QC anode and the Li/Li$^+$ electrode versus the specific capacity of graphite/AlCuFe QC composites from the first cycle to the 20th cycle. In the first discharge process, there is a charging-discharging platform with a small slope difference between 0.8 V and 0.6 V, which corresponds to the formation of the SEI film. The inclined platform with a larger slope around 0.45 V indicates the process of lithium ions embedding into another phase of the composites. The inclined plateau during charging corresponds to the removal process of lithium ions in the composite materials. Starting from the second cycle, the two inclined platforms of 0.8 V and 0.6 V have been greatly weakened, and the inclined platforms of 0.25 V are more obvious.
cpl-36-9-098201-fig7.png
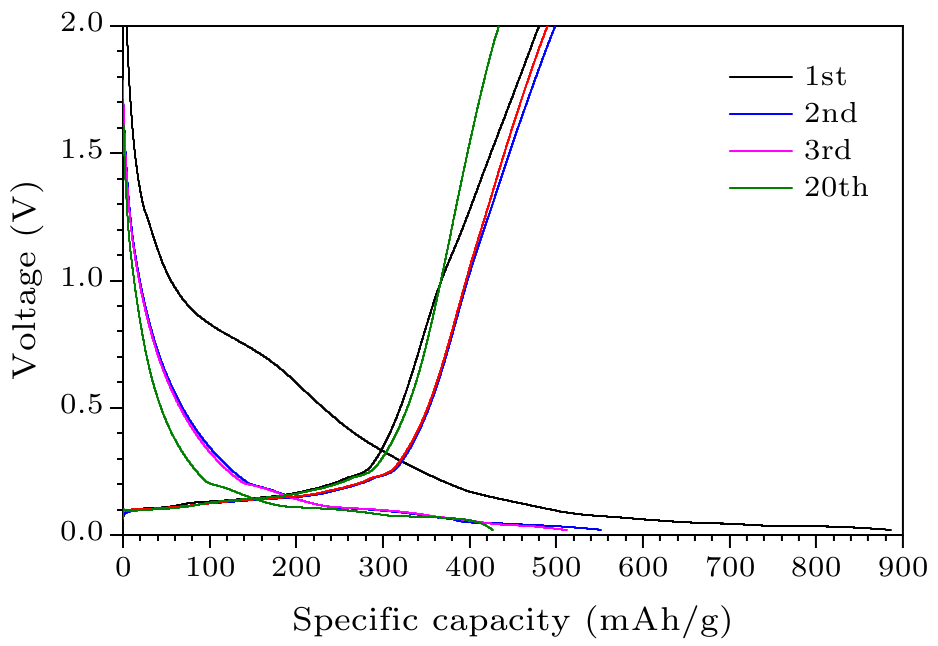
Fig. 7. The voltage between the graphite/AlCuFe QC anode and the Li/Li$^+$ electrode versus the specific capacity of graphite/AlCuFe QC composites from the first cycle to the 20th cycle.
Figure 8 shows the cyclic voltammetry curve of AlCuFe QC composites. In the first scan, a significant reduction peak appears at 0.35 V but disappears completely after the second scan, which is the characteristic reaction of the SEI film. The second reduction peak appears at about 0.8 V, and it exists steadily in the following nine scans. Along with the oxidation peak of 1.25 V, it corresponds to the intercalation and exfoliation of lithium ions in the active substance. However, the reduction peak tends to broaden and move towards the left with the increase of scanning times. It is indicated that the reversibility of the deintercalation of lithium by the active substance is good. With the increase of reaction time, more lithium-ion channels are opened and the reaction is easier.
cpl-36-9-098201-fig8.png
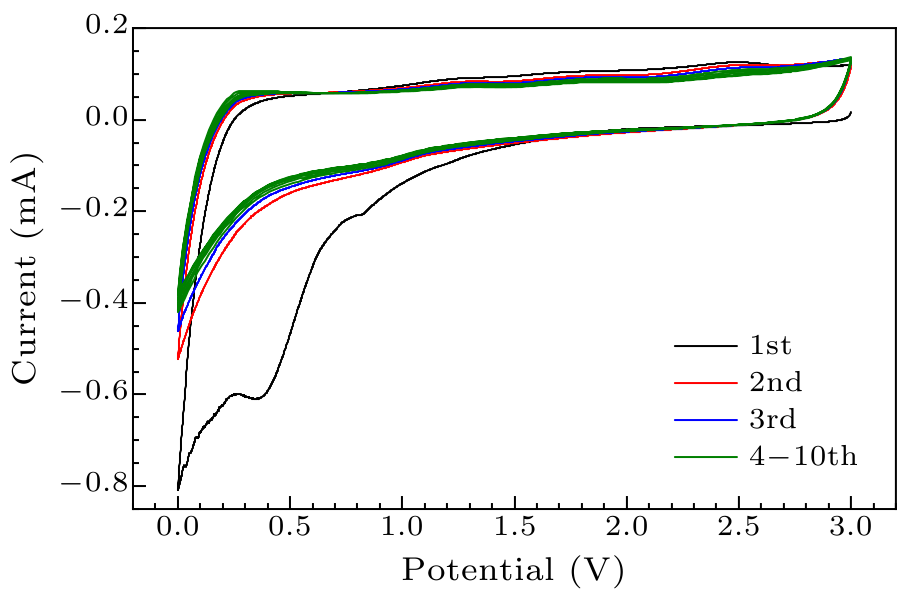
Fig. 8. Cyclic voltammetric curves of graphite/AlCuFe QC composites.
Figure 9 shows the impedance spectra of the graphite/AlCuFe QC composite electrode at different states (1th cycle, 2nd cycle, and 10th cycle). The low-frequency region straight line corresponds to the solid phase diffusion of lithium ions in matrix particles and the high-frequency region semicircle corresponds to the SEI film formation of the material and the passage of lithium ions through the SEI film. The first cycle shows a higher charge transfer resistance and higher Warburg impedance than those after the second and tenth cycles. This is because a large number of channels for the deintercalation of lithiumin the first cycle have not been fully opened and the diffusion of lithium ions is hindered. With the charge-discharge cycle processes, the semicircle and slope of the slanted line become smaller, which means that Li-ion transmission channels are opened, the number of active sites in the electrode increases, and the impedance of the active material decreases. The electrode material structure is more suitable for the intercalation/deintercalation of Li ions. The EIS results show that the modification of AlCuFe QCs can improve the electrochemical performance of the anode.
cpl-36-9-098201-fig9.png
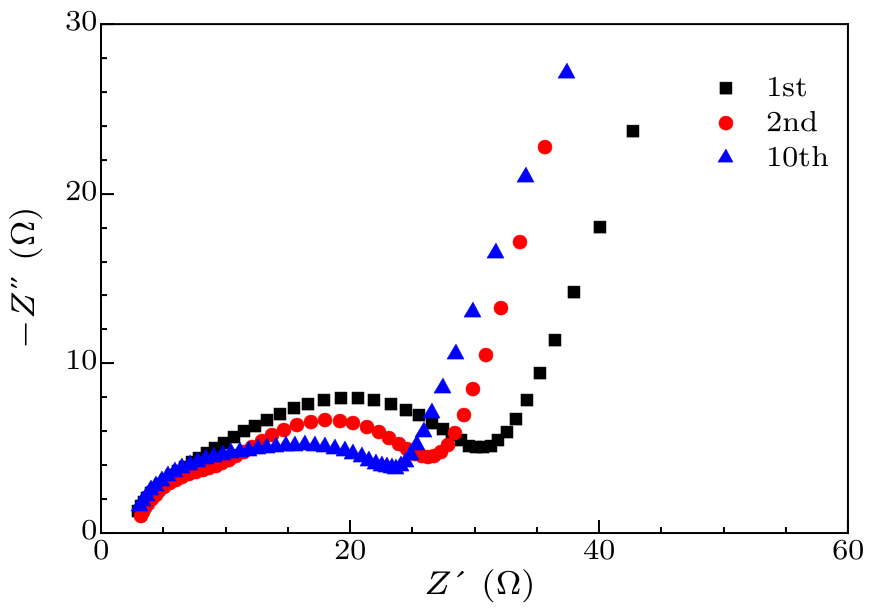
Fig. 9. Impedance spectra of graphite/AlCuFe QC composite anodes at different states.
In this summary, graphite/AlCuFe QC composites have been synthesized by ball milling. The electrochemical performance of graphite/AlCuFe QCs as anodes of LIBs is tested. The conclusions are as follows: (1) Planetary ball milling is suitable for the preparation of graphite/AlCuFe QC composites. When the milling parameter is 550 rpm for 80 h, graphite and AlCuFe QCs mix homogeneously. The structure of Al–Cu–Fe QCs does not change. (2) After milling, graphite forms coating on QCs. Carbon has an onion-like structure that forms an inhomogeneous encapsulation on QCs. (3) The capacity of graphite/AlCuFe QC composites is stable at 480 mAh/g, which is larger than the sum of graphite and Al–Cu–Fe QCs component. Graphite/AlCuFe QC composites exhibit capacity multiplication effect.
References Pair Distribution Function Analysis and Solid State NMR Studies of Silicon Electrodes for Lithium Ion Batteries: Understanding the (De)lithiation MechanismsDesigning nanostructured Si anodes for high energy lithium ion batteriesA review of the electrochemical performance of alloy anodes for lithium-ion batteriesSize-Dependent Fracture of Silicon Nanoparticles During LithiationEffects of particle size on the electrochemical properties of aluminum powders as anode materials for lithium ion batteriesAnode behaviors of aluminum antimony synthesized by mechanical alloying for lithium secondary batterySurface oxidation and thin film preparation of AlCuFe quasicrystalsElectrochemical hydrogen storage property of NiTi alloys with different Ti content prepared by mechanical alloyingHydrogen storage properties for Mg–Zn–Y quasicrystal and ternary alloysAl–Cu–Fe quasicrystals as the anode for lithium ion batteriesSynthesis of onion-like carbon-reinforced AlCuFe quasicrystals by high-energy ball millingHigh-performance lithium battery anodes using silicon nanowiresHigh capacity graphite–silicon composite anode material for lithium-ion batteries
[1] Key B, Morcrette M, Tarascon J M et al 2011 J. Am. Chem. Soc. 133 503
[2] Hui W and Yi C 2012 Nano Today 7 414
[3] Zhang W 2011 J. Power Sources 196 13
[4] Liu X H, Zhong L, Huang S et al 2012 ACS Nano 6 1522
[5] Lei X, Wang C, Yi Z et al 2007 J. Alloys Compd. 429 311
[6] Honda H, Sakaguchi H, Fukuda Y et al 2003 Mater. Res. Bull. 38 647
[7] Rouxel D and Pigeat P 2006 Prog. Surf. Sci. 81 488
[8] Jiang X Y, Liu Q S and Zhang L 2011 Rare Met. 30 (Suppl. 1) 63
[9] Luo X L, Grant D M and Walker G S 2015 J. Alloys Compd. 645 S23
[10] Lan X, Wang H, Sun Z et al 2019 J. Alloys Compd. 805 942
[11] Patiño-Carachure C, Flores-Chan J E, Gil A F et al 2017 J. Alloys Compd. 694 46
[12] Chan C K, Peng H, Liu G et al 2008 Nat. Nanotechnol. 3 31
[13] Fuchsbichler B, Stangl C, Kren H et al 2011 J. Power Sources 196 2889