Chinese Physics Letters, 2022, Vol. 39, No. 5, Article code 056101 Structural Evolution of $D_{5h}$(1)-C$_{90}$ under High Pressure: A Mediate Allotrope of Nanocarbon from Zero-Dimensional Fullerene to One-Dimensional Nanotube Yan Wang (王岩)1, Mingguang Yao (姚明光)1*, Xing Hua (华星)1, Fei Jin (金飞)2*, Zhen Yao (姚震)1, Hua Yang (杨华)2, Ziyang Liu (刘子阳)2, Quanjun Li (李全军)1, Ran Liu (刘然)1, Bo Liu (刘波)1, Linhai Jiang (江林海)1, and Bingbing Liu (刘冰冰)1* Affiliations 1State Key Laboratory of Superhard Materials, College of Physics, Jilin University, Changchun 130012, China 2College of Materials and Chemistry, China Jiliang University, Hangzhou 310018, China Received 1 March 2022; accepted 29 March 2022; published online 26 April 2022 *Corresponding authors. Email: yaomg@jlu.edu.cn; 1207481234@qq.com; liubb@jlu.edu.cn Citation Text: Wang Y, Yao M G, Hua X et al. 2022 Chin. Phys. Lett. 39 056101    Abstract The hybridization of fullerene and nanotube structures in newly isolated C$_{90}$ with the $D_{5h}$ symmetric group ($D_{5h}$(1)-C$_{90}$) provides an ideal model as a mediating allotrope of nanocarbon from zero-dimensional (0D) fullerene to one-dimensional nanotube. Raman and infrared spectroscopy combined with classical molecular dynamics simulation were used to investigate the structural evolution of $D_{5h}$(1)-C$_{90}$ at ambient and high pressure up to 35.1 GPa. Interestingly, the high-pressure transformations of $D_{5h}$(1)-C$_{90}$ exhibit the features of both fullerene and nanotube. At around 2.5 GPa, the $D_{5h}$(1)-C$_{90}$ molecule in the crystal undergoes an orientational transition to a restricted rotation. At 6.6 GPa, the tubular hexagonal part occurs and transforms into a dumbbell-like structure at higher pressure. The material starts to amorphize above 13.9 GPa, and the transition is reversible until the pressure exceeds 25 GPa. The amorphization is probably correlated with both the intermolecular bonding and the morphology change. Our results enrich our understanding of structural changes in nanocarbon from 0D to 1D.
cpl-39-5-056101-fig1.png
cpl-39-5-056101-fig2.png
cpl-39-5-056101-fig3.png
cpl-39-5-056101-fig4.png
cpl-39-5-056101-fig5.png
cpl-39-5-056101-fig6.png
DOI:10.1088/0256-307X/39/5/056101 © 2022 Chinese Physics Society Article Text Carbon possesses a unique capability to form various nanostructured allotropes such as fullerenes and nanotubes, which can be used in different fields, such as electronic devices and reinforcing materials. In these application fields, deformation in fullerenes and nanotubes may often exist, such as the interaction with a substrate or other composites, which subsequently affects their lattice, electronic structure, and related properties. If controllable in the nanostructured carbon materials, such deformation can open the way for producing new materials with novel properties. For instance, treating C$_{60}$ at high pressure and high-temperature (HPHT) conditions result in formation of deformed C$_{60}$ constructed in a 3D polymeric network,[1] or the formation of ultrahard amorphous carbon from collapsed fullerene cages.[2] The synthesis of superstrong amorphous carbon and paracrystalline diamond from HPHT-treated C60 has also been reported recently.[3,4] Wang et al. reported a long-range ordered carbon cluster with good mechanical properties and low compressibility comparable to a diamond by compressing C$_{60}$ fullerene-based materials.[5] In fact, mechanical response of fullerene-based materials under high pressure is also affected by intramolecular and intermolecular charge transfer.[6] However, how the C$_{60}$ cage deforms and what is the real molecular morphology after the deformation have rarely been studied, which are important to understand their properties. On the other hand, structure changes of carbon nanotubes under high pressure have attracted intensive research interest.[7–9] Araujo et al. studied the deformations and revealed chirality-dependent effects of single-walled carbon nanotubes (SWNTs) using an atomic force microscope.[10] According to theoretical simulations, the structural transitions of SWNTs under pressure are primarily determined by the tube diameter.[9] Experimentally, structural changes of SWNTs are strongly influenced by their length, diameter, and even defects, which often coexist in the samples and make the analysis and identification difficult. Unfortunately, preparing an SWNT sample with the same diameter and chirality in an experimental setting remains difficult. In other words, understanding the deformation process is important for both fundamental research and application aspects. However, there is lack of charity about the structural stability and deformation of these nanostructured allotropes at an atomic level, as well as how to identify them. The recent success in synthesizing and isolating high purity single isomers of various higher fullerenes[11–14] provides a good opportunity to investigate the structural transition of carbon nanostructures with the hybridized fullerene structural features and nanotube. Particularly, C$_{90}$ with $D_{5h}$ symmetry ($D_{5h}$(1)-C$_{90})$[15] has 12 pentagons and 35 hexagons, and can be taken as a nanostructure coupled to a short armchair single-walled carbon nanotube and end-capped by fullerene (see the sketch map shown in Fig. S1 of the Supporting Information). In $D_{5h}$(1)-C$_{90}$, one of the half C$_{60}$ was rotated by 36$^{\circ}$ relative to the other, and 30 carbon atoms were inserted between.[15] A nanotube with a minimum length of 1.1 nm and a diameter of 0.7 nm can exist in air and used as a nanotube sample with the same diameter and chirality. This provides an ideal model for mediating allotrope of nanocarbon from zero-dimensional (0D) fullerene to one-dimensional (1D) nanotube, which is still unexplored in high-pressure research. In this Letter, we study the Raman and infrared (IR) spectra of $D_{5h}$(1)-C$_{90}$ under ambient conditions in both experiment and theory, and the main vibration modes have been assigned for the first time. The cage stability, morphology evolution of $D_{5h}$(1)-C$_{90}$ single isomer, and the crystalline structure transition of $D_{5h}$(1)-C$_{90}$ under high pressure have been investigated using Raman/IR spectroscopy combined with theoretical simulation. Due to the hybridization structures of fullerene and nanotube, the high-pressure evolution of $D_{5h}$(1)-C$_{90}$ exhibits the transition features of both fullerene and nanotube. The results are the first example of a mediating allotrope of nanocarbon from 0D fullerene to 1D nanotube. They may provide insight on the understanding of structural changes in fullerene cage and nanotube at an atomic scale. Experiments. A pure $D_{5h}$(1)-C$_{90}$ isomer sample was isolated from the raw soot produced by Sm$_{2}$O$_{3}$-doped graphite rods.[15] The as-prepared powder samples were treated under vacuum to remove the remained solvent. A small piece of $D_{5h}$(1)-C$_{90}$ samples and a pressure transmission medium (PTM) were loaded in the sample chamber drilled in a preindented steel gasket of a Mao–Bell-type diamond-anvil cell in the high-pressure Raman experiment. A $4\!:\!1$ methanol to ethanol mixture or liquid argon was used as PTM, which gave quite similar results. A Raman spectrometer (Renishaw inVia, UK) was used for the measurements. High-pressure IR measurements were conducted at the U2A beamline, National Synchrotron Light Source, Brookhaven National Laboratory, and have been repeated in our Laboratory. A symmetrical diamond-anvil cell with a pair of type IIa diamond anvils was used with liquid argon as the PTM. The sample chamber was filled with a $D_{5h}$(1)-C$_{90}$ powder sample and liquid argon (PTM). The mid-IR spectra were collected in a transmission mode by a Bruker Vertex 80v FTIR spectrometer and a Hyperion 2000 IR microscope equipped with a nitrogen-cooled MCT detector at U2A side station. During the measurements, the spectrometer was evacuated, and the microscope was purged with dry nitrogen gas. The aperture size was set as 25 µm $\times 25$ µm and the synchrotron IR beam was focused onto the argon area first, then moved to the sample area to measure the reference spectrum at each pressure. The spectra were collected from 500 to 7000 cm$^{-1}$ with resolution of 4 cm$^{-1}$, and 2048 scans were applied to all spectra. Both Raman and IR measurements were performed at room temperature, and the pressure was calibrated with the ruby fluorescence technique. Since the Raman and IR spectra of $D_{5h}$(1)-C$_{90}$ have not been reported before, theoretical calculations were performed to investigate and identify its vibration modes. The molecular geometries were optimized using the density functional theory method with a B3LYP hybrid functional 6–311g(d) basis set.[16] Both the frequency and intensity of each vibration mode were calculated. All calculations were performed using the Gaussian 09 package. The Gauss View program proposed an initial geometry of investigated molecules and a visual inspection of the vibration modes. We performed classical molecular dynamics simulations using the universal force field implemented in the Material Studio package to validate the structure of $D_{5h}$(1)-C$_{90}$ under high pressure. This force field includes van der Waals, bond stretch, bond angle bend, inversion, and torsion. Considering the interaction between adjacent $D_{5h}$(1)-C$_{90}$ molecules, we used the Lennard–Jones 12–6 potential to describe the van der Waals interaction between molecules.[17] For the simulation, we construct a $2 \times 3 \times 2$ supercell model according to the experimentally determined crystal parameters, which contains 48 $D_{5h}$(1)-C$_{90}$ molecules in a box with periodic boundary conditions in all three directions. Then, we performed the molecular dynamics in the microcanonical ensemble (constant number of particles, pressure, and temperature) during 20 ps (in time steps of 1 fs). To compare with the experimental results, simulations were performed in the pressure range from 0 to 14 GPa at room temperature (298 K). Results. Figure 1(a) shows the Raman spectra of the $D_{5h}$(1)-C$_{90}$ measured with 514 nm excitation wavelength under ambient conditions. In the frequency range from 100 to 1700 cm$^{-1}$, we observe more than 14 Raman peaks. The calculated Raman spectrum for $D_{5h}$(1)-C$_{90}$ is added in Fig. 1(a). This figure shows that the simulated Raman spectrum has features quite similar to those of the experimental one, including the vibration frequencies and intensities. The most important Raman modes can be well distinguished and assigned based on the results. The radial breathing modes of $D_{5h}$(1)-C$_{90}$ in the low-frequency region are from 100 to 600 cm$^{-1}$. The bending vibrations are observed from 600 cm$^{-1}$ to 1000 cm$^{-1}$. The modes observed in the frequency range from 1000 to 1600 cm$^{-1}$ are the stretching vibration modes of $D_{5h}$(1)-C$_{90}$.
cpl-39-5-056101-fig1.png
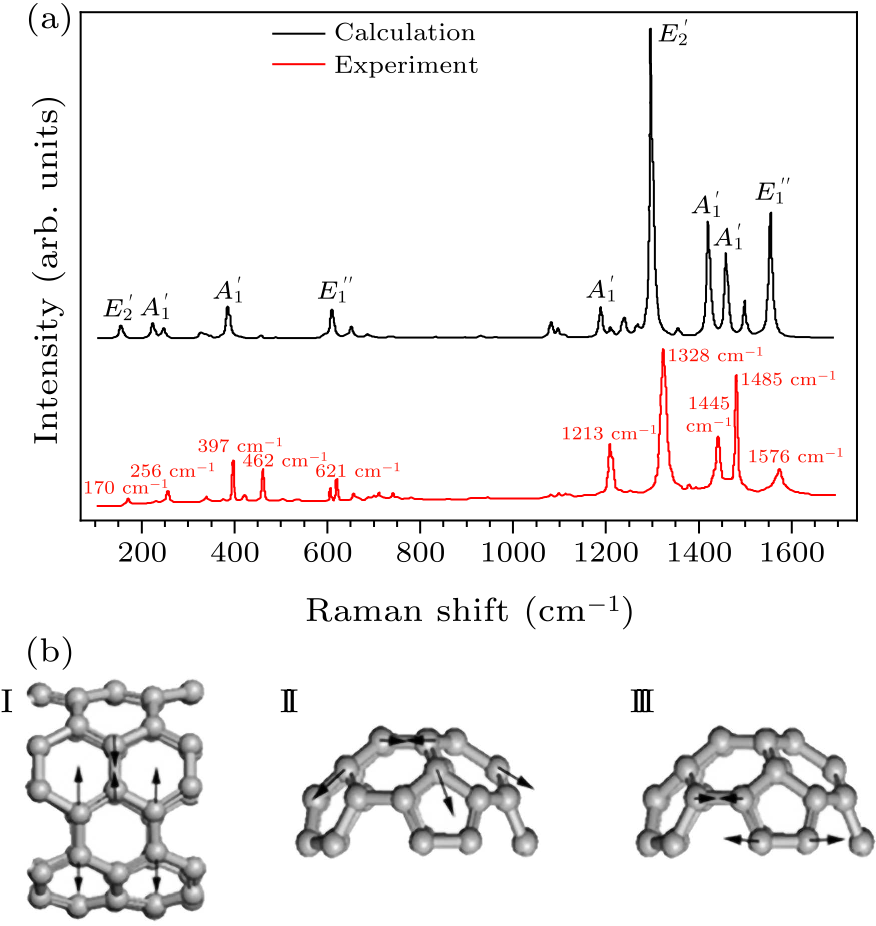
Fig. 1. (a) Experimental and calculated Raman spectra of $D_{5h}$(1)-C$_{90}$ (by Gaussian 09) under ambient conditions. (b) The eigenvectors of Raman vibration modes for four bands at 1213 cm$^{-1}$ (I), 1445 cm$^{-1}$ (II), 1485 cm$^{-1}$ (III), and 1576 cm$^{-1}$ (IV), respectively.
Here, we focus on the four strongest Raman modes observed at 1213 cm$^{-1}$, 1445 cm$^{-1}$, 1485 cm$^{-1}$, and 1576 cm$^{-1}$, which are important for understanding the transformations of $D_{5h}$(1)-C$_{90}$ under pressure (see below). To simplify the problem, we divided a $D_{5h}$(1)-C$_{90}$ molecule into two parts to discuss, i.e., the tubular part in the middle and two bowl-shaped caps of the ends. The Raman peaks observed at 1213 cm$^{-1}$ and 1576 cm$^{-1}$ are from the stretching vibrations of a hexagon in the tubular part and belong to $A_{1}'$ mode and $E_{1}''$ mode, respectively, compared with the model in Fig. 1(b). The $E_{1}'$ mode at 1445 cm$^{-1}$ stands for a stretching vibration of the pentagon in a bowl-shaped part. The mode at 1485 cm$^{-1}$ ($A_{1}'$) is related to the bending vibration at the edge of a bowl-shaped part. Figure 2(a) shows the Raman spectra of $D_{5h}$(1)-C$_{90}$ measured with 514 nm laser excitation under high pressure up to 35.1 GPa. Most of the vibration modes shift to higher frequencies with pressure increasing, except for the mode at 608 cm$^{-1}$. Similar pressure-induced redshift was also observed in the Raman mode at a similar frequency region of C$_{60}$ in earlier studies.[18] The blue shift for bands related to C–C/C=C vibrations may result from the $D_{5h}$(1)-C$_{90}$ cage shrinkage with pressure increasing or the $D_{5h}$(1)-C$_{90}$ cage deforms anisotropically under pressure. Furthermore, most of the Raman peaks become broader and weaker with pressure increasing. At the pressure above 6.7 GPa, most peaks in the low-frequency region (from 200 to 1000 cm$^{-1}$) disappeared. At pressures above 13.9 GPa, the intramolecular vibration modes lost their features, and only one broad peak at around 1576 cm$^{-1}$ was observed. The broadband shifts to higher frequencies and reaches a position centered at around 1700 cm$^{-1}$ at a pressure higher than 20 GPa, suggesting that the $D_{5h}$(1)-C$_{90}$ cage starts to collapse. This broadband becomes more obvious at 22.8 GPa and is detectable even at 35.1 GPa.
cpl-39-5-056101-fig2.png
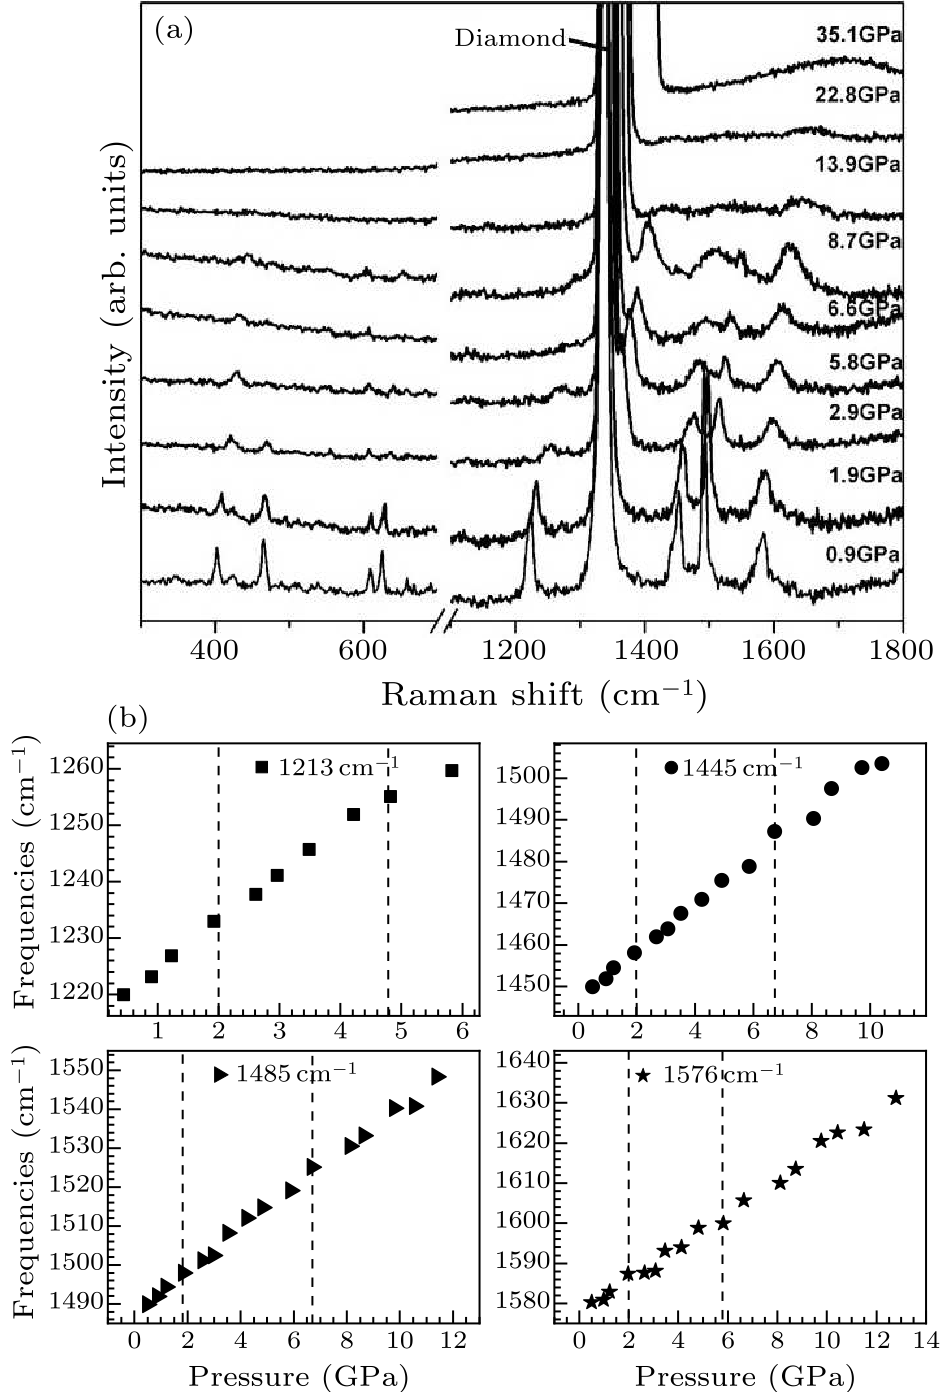
Fig. 2. (a) In situ Raman scattering spectra of $D_{5h}$(1)-C$_{90}$ measured with 514 nm laser excitation at different pressures. (b) Pressure-dependent frequencies of the Raman vibration modes of $D_{5h}$(1)-C$_{90}$ in the pressure regime. The initial positions of the four bands are at 1213 cm$^{-1}$, 1445 cm$^{-1}$, 1485 cm$^{-1}$, and 1576 cm$^{-1}$, respectively.
To study pressure-induced structural transformations in $D_{5h}$(1)-C$_{90}$, we further plotted the pressure frequency for the four representative Raman modes at 1213 cm$^{-1}$, 1445 cm$^{-1}$, 1485 cm$^{-1}$, and 1576 cm$^{-1}$ in Fig. 2(b). A Lorentzian fitting obtains the frequencies of these vibration modes at pressures up to 16 GPa. Table S1 in the Supporting Information shows the frequency coefficients ($d\omega /dp$) for the four Raman modes. From Fig. 2(b) and Table S1, we can see two slope changes at around 2.5 GPa and 6.6 GPa for the pressure dependence of the four Raman modes. IR spectroscopy is further employed to investigate the transformations of $D_{5h}$(1)-C$_{90}$ under high pressure, which can provide complementary information on the vibration modes of the molecules. Figure 3(a) shows the mid-infrared (MIR) spectrum of $D_{5h}$(1)-C$_{90}$ measured under ambient conditions. We also calculated the IR spectrum of $D_{5h}$(1)-C$_{90}$ under ambient conditions by Gaussian 09 and DMOL3 (Materials Studio 5.5),[17] and both the methods generated quite similar results. It can be seen that the simulated spectrum shows the features similar to those of the experimental one. The IR spectrum of $D_{5h}$(1)-C$_{90}$ can be roughly divided into three parts based on the simulation, which is similar to the Raman results: (1) The IR bands below 650 cm$^{-1}$ are mainly from the breathing vibration modes of the carbon cage. (2) The bands between 650 cm$^{-1}$ and 1000 cm$^{-1}$ are manifested as bending vibration modes. (3) The bands from 1000 cm$^{-1}$ to 1600 cm$^{-1}$ are attributed to C–C/C=C stretching vibrations.
cpl-39-5-056101-fig3.png
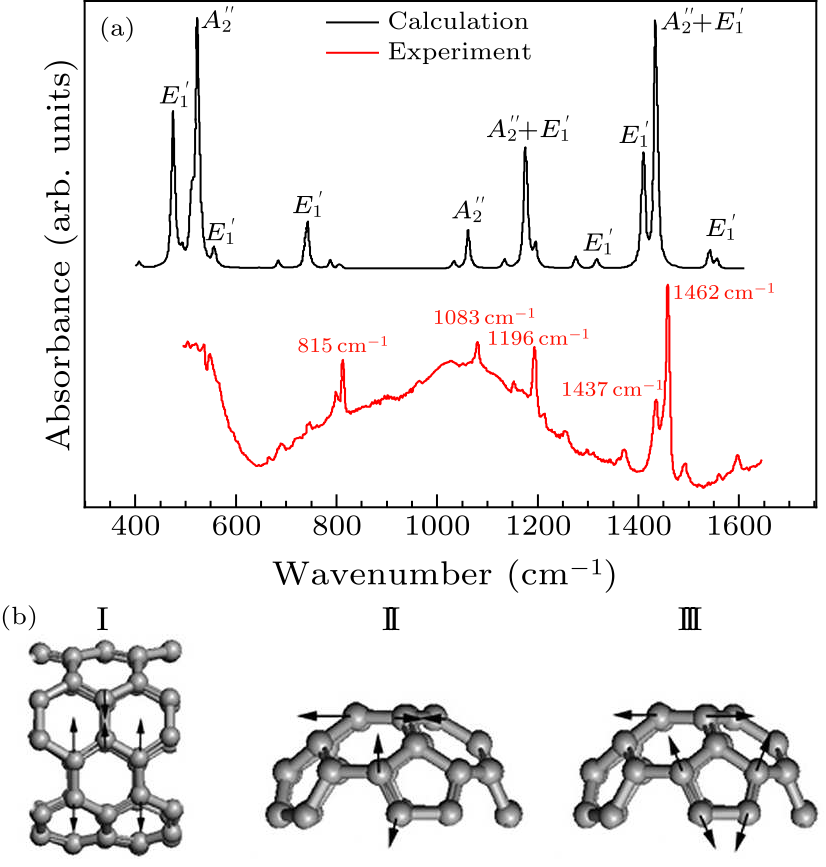
Fig. 3. (a) Experimental and calculated infrared spectra of $D_{5h}$(1)-C$_{90}$ (by Gaussian 09) under ambient conditions. (b) The eigenvectors of IR vibration modes for five bands at 815 cm$^{-1}$ (I), 1083 cm$^{-1}$ (I), 1196 cm$^{-1}$ (I), 1437 cm$^{-1}$ (II), and 1462 cm$^{-1}$ (III), respectively.
Similarly, we can assign the main IR modes to the corresponding vibration of the molecule according to the calculation results and the visual inspection of the vibration modes by Gauss View. The five strongest IR modes observed at 815 cm$^{-1}$, 1083 cm$^{-1}$, 1196 cm$^{-1}$, 1437 cm$^{-1}$, and 1462 cm$^{-1}$ are focused here. As shown in Fig. 3(b), the $E_{1}'$ mode at 815 cm$^{-1}$, the $A_{2}''$ modes at 1083 cm$^{-1}$ and 1196 cm$^{-1}$ can be assigned to the stretching vibration of a hexagon in a tubular part, respectively. The $E_{1}'$ modes observed at 1437 cm$^{-1}$ and 1462 cm$^{-1}$ represent a bending vibration and a stretching vibration of the pentagon in the bowl-shaped part, respectively. In situ high-pressure infrared spectra of $D_{5h}$(1)-C$_{90}$ has been measured from ambient condition up to 25 GPa. Figure 4(a) shows the collected IR spectra of $D_{5h}$(1)-C$_{90}$ in the region from 700 cm$^{-1}$ to 1600 cm$^{-1}$ at different pressures. It shows that the vibration modes shift to higher frequencies as pressure increases, with the exception of the mode at 815 cm$^{-1}$, which shifts to lower frequencies upon compression, implying that the modes have different pressure responses. The pressure-induced redshift of IR vibration modes has also been observed in earlier infrared studies of C$_{70}$ under high pressure.[19,20] The van der Waals interaction is strengthened when the molecules approach to each other with increasing pressure. Therefore, it will hinder lattice compression.[5] It can also be used to explain the redshift of Raman mode.
cpl-39-5-056101-fig4.png
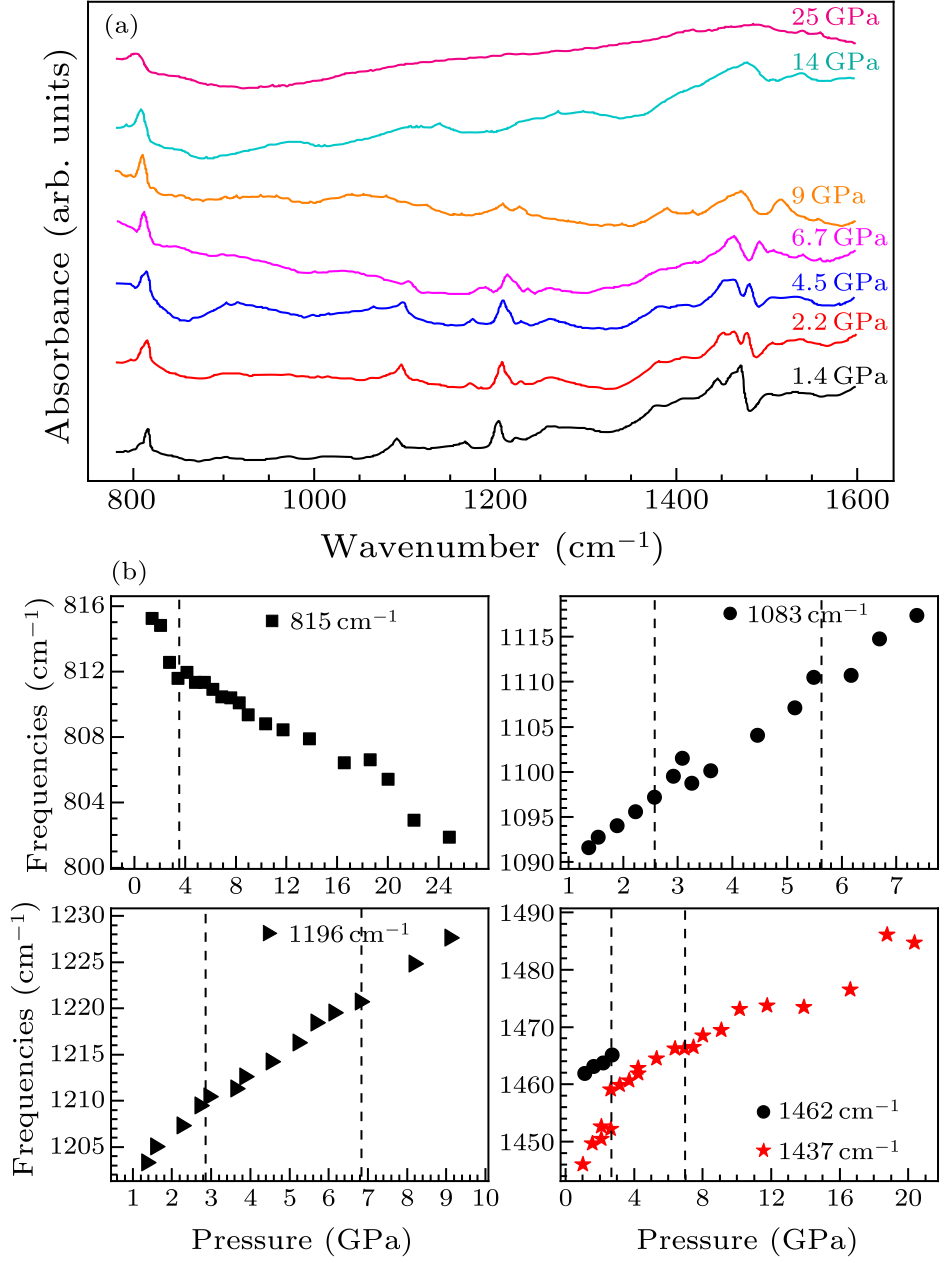
Fig. 4. (a) Mid-IR absorption spectra of $D_{5h}$(1)-C$_{90}$ at different pressures. (b) Pressure dependence of the peak positions for the five selected infrared vibration modes of $D_{5h}$(1)-C$_{90}$. The initial positions of the five bands are at 815 cm$^{-1}$, 1083 cm$^{-1}$, 1196 cm$^{-1}$, 1437 cm$^{-1}$, and 1462 cm$^{-1}$, respectively.
Interestingly, in this study, the mode at 815 cm$^{-1}$ can be preserved throughout the experiment and only becomes weaker and broader in the high-pressure region. It is noted that the peak at 1462 cm$^{-1}$ is separated from the peak at 1471 cm$^{-1}$ and then coincides with the peak at 1437 cm$^{-1}$ at around 2.9 GPa. The merged peak can be preserved up to 26 GPa, the highest pressure in our experiment. As pressure increases, the intensities of most modes decrease, and lines broaden significantly at 6.7 GPa. At pressure higher than 14 GPa, the infrared spectra show broadband at around 1460 cm$^{-1}$, indicating the collapse of the $D_{5h}$(1)-C$_{90}$ cage. The positions of the five intensive infrared modes at 815 cm$^{-1}$, 1083 cm$^{-1}$, 1196 cm$^{-1}$, 1437 cm$^{-1}$, and 1462 cm$^{-1}$ are plotted as a function of pressure by Lorentzian fitting in Fig. 4(b) to demonstrate the transformation of $D_{5h}$(1)-C$_{90}$ under pressure. At 1.6–3.5 GPa, the slope of the plotted curves for all five mode changes, following a second slope change at around 6.7 GPa. These two transition pressures are consistent with our Raman measurements. The corresponding pressure coefficients for the modes are listed in Table S2. We also measured the ambient-condition Raman spectra of the samples released from different pressures using 514 nm laser excitation to investigate the structural stability of the $D_{5h}$(1)-C$_{90}$ after compression. The result is shown in Fig. S2(a). Upon decompression from 24 GPa, the Raman spectrum and the IR spectrum of the recovered sample [see Fig. S2(b)] still preserve most spectroscopic features compared to that of the pristine sample, suggesting that the transition is reversible upon decompression. Only broadband can be observed at 1570 cm$^{-1}$ in the recorded Raman spectra of the sample released from 35.1 GPa, which shows the features similar to those of amorphous carbon-containing sp3 bonds founded in compressed C$_{70} $,[21,22] as shown in Fig. S2(a). This suggests that $D_{5h}$(1)-C$_{90}$ irreversibly collapses after such high-pressure compression. The experimental results from both Raman and infrared measurements under high pressure thus clearly show that three transitions occur in the material at around 2.5 GPa, 6.6 GPa, and 13.9 GPa, respectively. We performed a classical molecular dynamics simulation on $D_{5h}$(1)-C$_{90}$ s to explain the three transitions and the deformation process of $D_{5h}$(1)-C$_{90}$ under pressure. Discussion. The experimentally generated $D_{5h}$(1)-C$_{90}$ single crystal is a black parallelepiped with a monoclinic structure ($a = 22.6$ Å, $b = 12.3$ Å, $c = 20.7$ Å, and space group $P_{21}/c$). We used these experimental parameters to build the crystal model in our simulation. Figure 5 shows the structure and arrangement of $D_{5h}$(1)-C$_{90}$ under pressure from the simulations. The orientational arrangement of $D_{5h}$(1)-C$_{90}$ shown in Fig. 5(a) is viewed from the (001) plane of the monoclinic structure. The $D_{5h}$(1)-C$_{90}$ molecules are orientationally disordered under ambient conditions. The orientation of $D_{5h}$(1)-C$_{90}$ molecules is changed with the pressure increasing. It shows that all $D_{5h}$(1)-C$_{90}$ molecules exhibit a uniform orientational arrangement aligned along the $b$ $(Y)$ axis above 2 GPa. All $D_{5h}$(1)-C$_{90}$ molecules are almost lying in the cell along an $(X)$ axis. This orientation is preserved for all $D_{5h}$(1)-C$_{90}$ molecules even up to the highest pressure of 14 GPa in our simulation. Such pressure-induced orientation changes at above 2 GPa can also be observed from the (010) plane direction [Fig. 5(b)]. We can further point out that the $D_{5h}$(1)-C$_{90}$ molecules can rotate freely in the lattice below 2 GPa, while the molecular rotation was restricted above 2 GPa due to the compression of the lattice, and the molecules can only rotate around the long axis of $D_{5h}$(1)-C$_{90}$ due to a spatial restriction.
cpl-39-5-056101-fig5.png
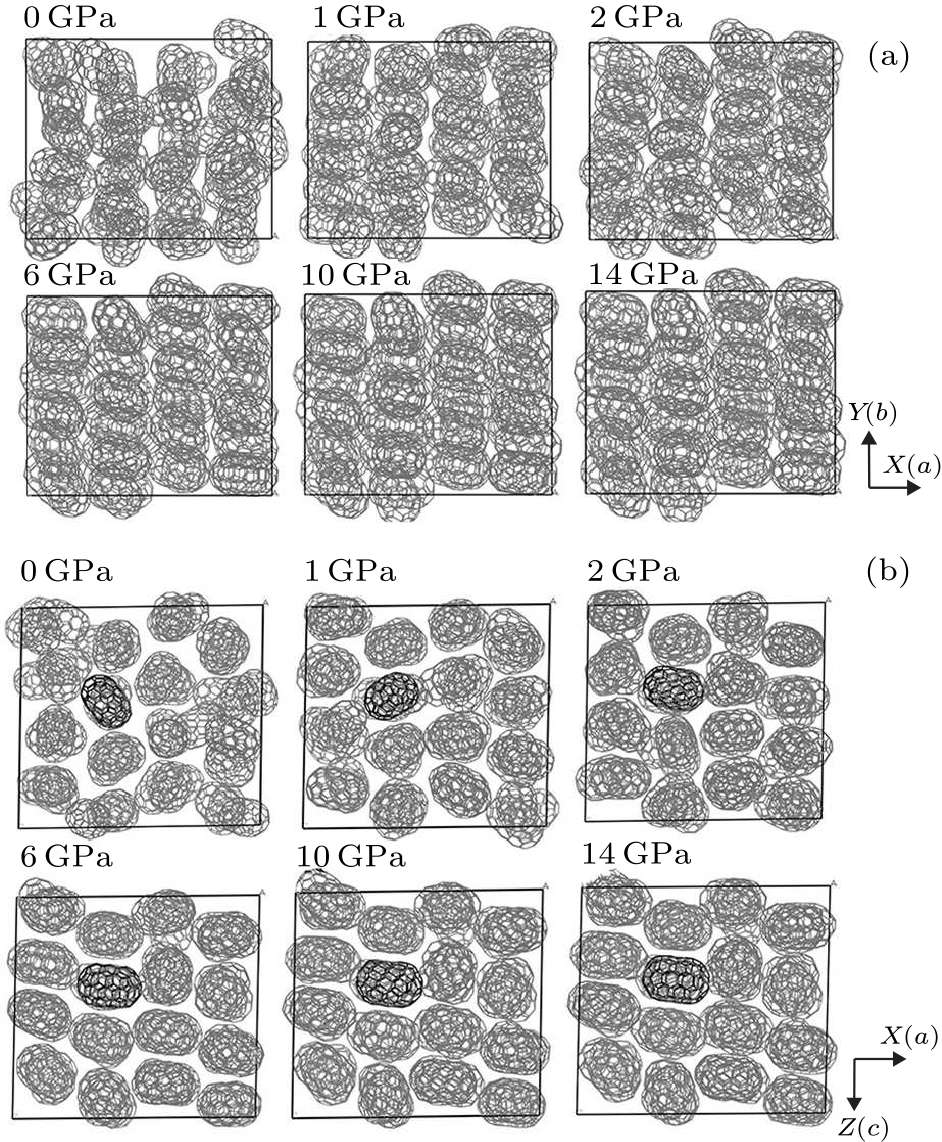
Fig. 5. (a) Orientations of $D_{5h}$(1)-C$_{90}$ at different pressures. (b) The rotations of $D_{5h}$(1)-C$_{90}$ at different pressures. The results are simulated by Materials Studio 5.5.
The observed spectroscopic changes in the experiment at around 2.5 GPa can be explained by orientation-related rotation transition of $D_{5h}$(1)-C$_{90}$ molecules detected by our dynamics simulation, which results in the slope change of the pressure dependence for most of the observed Raman and IR modes. At around 2 GPa, similar spectroscopic changes have also been observed in other fullerenes, such as C$_{70}$, where the slope of the Raman frequency vs pressure ($d\omega/d\rho$) curved is changed.[23,24] These spectroscopic changes were attributed to phase transitions caused by an orientational ordering of C$_{70}$ molecules. Note that, although the orientational transition has been proposed in those fullerene systems under pressure before, our simulations for the first time show the existence of such orientational transition in fullerene materials under pressure. We further propose that the molecular symmetry and morphology are preserved during the orientational phase transition, while some motion/rotation of the molecules stops. Thus, the rotation no longer averages out the symmetry, and the molecule is locked in a fixed position in the crystal. Thus, all vibration modes can be preserved but changed in the slope of their pressure coefficients due to the change in the intermolecular interaction. Furthermore, as pressure increases, the molecular spacing reduces gradually, resulting in a more compact material. Such changes in intermolecular interaction, with the application pressure, can result in an obvious deformation of the molecules. We thus measured the length of the $D_{5h}$(1)-C$_{90}$ molecules, the diameter of the tubular part, and the bowl-shaped part at each pressure point up to 14 GPa using the Material Studio package. We measured the same pair of atoms of the same $D_{5h}$(1)-C$_{90}$ molecule in the middle of the supercell at each pressure point to get an accurate result. The pressure dependence of the length ($dl/dp$) and diameter ($dR/dp$) of $D_{5h}$(1)-C$_{90}$ molecules are shown in Fig. 6(a). The length and the tubular diameter of the $D_{5h}$(1)-C$_{90}$ cage are compressed and decrease obviously at 6 GPa, while little change occurs in the bowl-shaped part, suggesting the deformation of $D_{5h}$(1)-C$_{90}$ molecule. The molecular deformation demonstrated by the simulation can be well correlated with the pressure evolution of the Raman and infrared modes in an experiment. According to the vibration mode assignments shown in Tables S3 and S4, we have compared the pressure coefficients $d\omega /dp$ and the critical pressures where the modes disappear for each mode of $D_{5h}$(1)-C$_{90}$. The experimental results show that the modes with large pressure coefficients $d\omega /dp$ are mainly observed in the stretching vibration of hexagons in the tubular part and lower corresponding critical pressures. For example, the Raman mode starting from 1213 cm$^{-1}$ and the IR mode starting from 1083 cm$^{-1}$ in the corresponding spectra exhibit the largest pressure coefficient of 8.2 cm$^{-1}$ GPa$^{-1}$ and 4.2 cm$^{-1}$ GPa$^{-1}$, respectively. The larger the pressure coefficient it shows, the more significant deformation occurs in the corresponding part of the molecule. In contrast, small pressure coefficients $d\omega /dp$ are mostly observed in the vibration of the pentagon in bowl-shaped caps, and indeed less deformation is observed in this part based on our simulations. This shows that applying pressure significantly affects tubular deformation than the two caps in $D_{5h}$(1)-C$_{90}$ molecules. Furthermore, the deformation pressure of 6.6 GPa for the tubular part of $D_{5h}$(1)-C$_{90}$ from our experiment and simulation is similar to the predicted transition pressure of 7–8 GPa for the SWNT with the same diameter (0.7 nm).[7] In contrast, the transition of C$_{60}$ molecules in this pressure range is usually related to the intermolecular bonding of polymerization due to the active C=C bonds on the C$_{60}$ cage; while for C$_{70}$, the polymerization becomes less efficient[25] in that only the double bonds on the polar caps of the C$_{70}$ molecule are reactive. In contrast, the cyclic double bonds on the equatorial belt are ineffective in undergoing (2 + 2) cycloaddition reactions. This gives strict topological constraints on forming long-range ordered polymers of C$_{70}$. In our $D_{5h}$(1)-C$_{90}$, the tubular part should be unreactive, and the polymerization of the caps of C$_{90}$ is less efficient, similar to the case of C$_{70}$.[26] Thus, the deformation of $D_{5h}$(1)-C$_{90}$ is closely related to the tube diameter, and $D_{5h}$(1)-C$_{90}$ exhibits compression behavior in this case.
cpl-39-5-056101-fig6.png
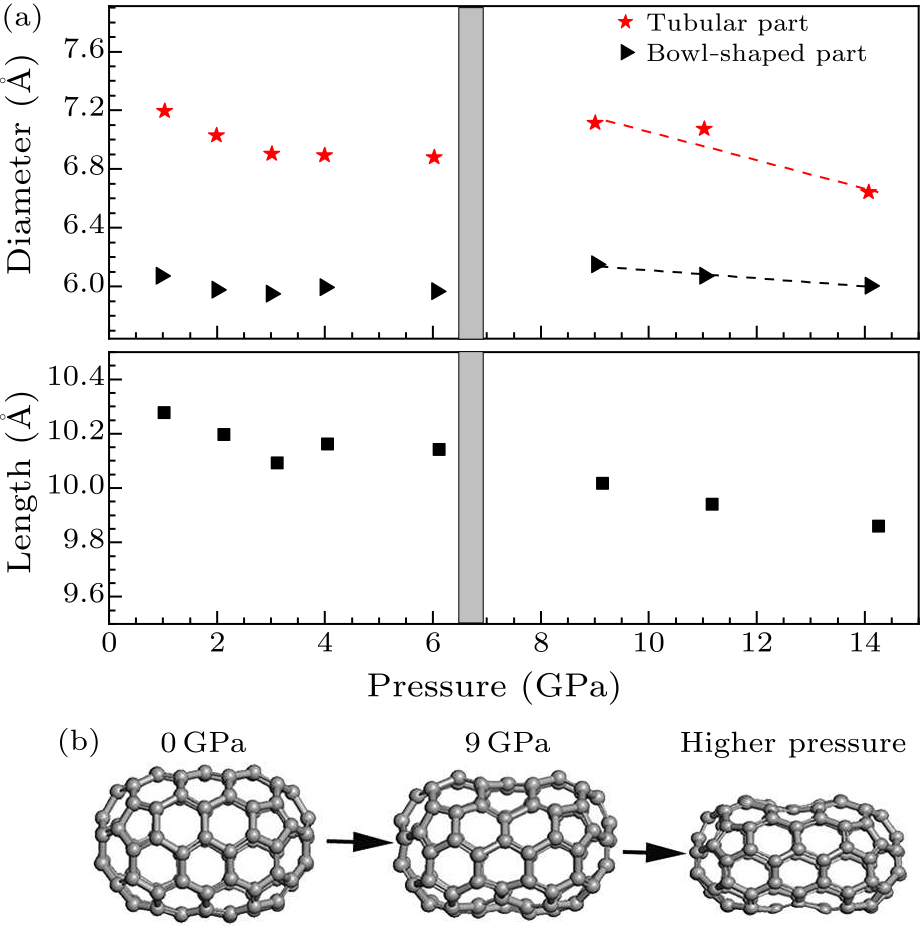
Fig. 6. (a) Pressure dependence of the lengths of $D_{5h}$(1)-C$_{90}$ and the diameters of the tubular and bowl-shaped parts. (b) The deformation process of $D_{5h}$(1)-C$_{90}$ under pressure.
At higher pressure, the structure of the $D_{5h}$(1)-C$_{90}$ molecule changes from an elongated elliptical to a dumbbell-like shape. Such unique structures formed at high pressure may be used as good building blocks to construct new carbon materials with new properties. The amorphization transition of $D_{5h}$(1)-C$_{90}$ molecules starts from 13.9 GPa. As pressure increases, the molecules are deformed more seriously, and the intermolecular bonding may further accelerate the amorphization of the molecules, which may be underestimated in our simulation. Intermolecular bonding is one of the important reasons for driving the amorphization of C$_{60}$ when compressing fullerenes, resulting in the formation of aggregation. A similar transition has also been observed in fullerenes[27] or carbon nanotubes[28,29] in a similar pressure range. For example, the cross section of single-wall carbon nanotubes collapses. The inter-tubular bonding may also form at around 15 GPa, which results in the significant weakening and broadening of the G-band and initiates nanotubes' structural collapse/amorphization.[28,29] However, the reversibility of the amorphous phase on decompression is suggested to be related to the relative strengths of the repulsive intermolecular interaction and the intramolecular interaction.[27] The molecules can be permanently distorted/destroyed if the former is sufficiently higher, leading to an irreversible transition. In summary, we have investigated the IR and Raman spectra of $D_{5h}$(1)-C$_{90}$ under ambient conditions and under high pressure. First, the main vibration modes in the recorded spectra under ambient conditions have been assigned. The transitions of $D_{5h}$(1)-C$_{90}$ related to the crystal structure and molecular morphology when compressed are demonstrated using a dynamics simulation. The transformations exhibit the features of both fullerene and nanotube. At around 2.5 GPa, an orientational transition occurs in a crystalline structure, and the free rotation of the $D_{5h}$(1)-C$_{90}$ molecules transforms into a restricted rotation around the long axis of the molecules. At 6.6 GPa, the $D_{5h}$(1)-C$_{90}$ molecule cage starts to deform, in which the deformation of the tubular part is more significant than the bowl-shaped caps. The morphology of the molecular cage is changed from an elongated ellipse to a dumbbell-like shape at higher pressure. When used as building blocks, the transformed carbon nanostructure with such unique morphology may be favorable for design of new materials. The amorphization of the material is initiated at 13.9 GPa and is probably correlated with both the intermolecular bonding and molecular morphology change. The unique transitions observed in $D_{5h}$(1)-C$_{90}$ enrich our understanding of structural changes in nanocarbon from 0D to 1D in general. In the Supporting Information, we give additional images and tables for $D_{5h}$(1)-C$_{90}$ at ambient pressure and high pressure. Acknowledgement. We thank Professor Bertil Sundqvist for helpful discussion and Dr. Zhenxian Liu for technical support. This work was supported financially by the National Key R&D Program of China (Grant No. 2018YFA0305900), and the National Natural Science Foundation of China (Grant Nos. 12011530063 and 51822204). The use of the beamline U2A at NSLS was supported by NSF (DMR-0805056; EAR 06–49658, COMPRES) and DOE/NNSA (DE-FC03-03N00144, CDAC). NSLS was supported by the DOE/BES (DE-AC02-98CH10886).
References Topochemical 3D Polymerization of C60 under High Pressure at Elevated TemperaturesUltrahard bulk amorphous carbon from collapsed fullereneDiscovery of carbon-based strongest and hardest amorphous materialSynthesis of paracrystalline diamondLong-Range Ordered Carbon Clusters: A Crystalline Material with Amorphous Building BlocksNegative Volume Compressibility in Sc3 N@C80 –Cubane Cocrystal with Charge TransferCollapse of Single-Wall Carbon Nanotubes is Diameter DependentGeometric Constant Defining Shape Transitions of Carbon Nanotubes under PressurePhase diagram of single-wall carbon nanotube crystals under hydrostatic pressureIn Situ Atomic Force Microscopy Tip-Induced Deformations and Raman Spectroscopy Characterization of Single-Wall Carbon NanotubesA Metallofullertube of Ce2 @C100 with a Carbon Nanotube Segment: Synthesis, Single‐Molecule Conductance and Supramolecular AssemblyEr@C82 as a Bifunctional Additive to the Spiro‐OMeTAD Hole Transport Layer for Improving Performance and Stability of Perovskite Solar CellsA supramolecular polymeric heterojunction composed of an all-carbon conjugated polymer and fullerenesIsolation and Crystallographic Identification of Four Isomers of Sm@C90Isolation of a Small Carbon Nanotube: The Surprising Appearance of D5h(1)-C90The Vibrational Spectrum of Fullerene C60Molecular dynamics simulation of single wall carbon nanotubes polymerization under compressionSynthesis and high pressure induced amorphization of C60 nanosheetsInfrared study of vibrational property and polymerization of fullerene C60 and C70 under pressureHigh-pressure infrared spectroscopic study of buckminsterfullerene, C60Resonant Raman scattering of amorphous carbon and polycrystalline diamond filmsPreparation and properties of highly tetrahedral hydrogenated amorphous carbonPressure-Induced Phase Transitions of C70 NanotubesPhotoinduced polymerization of solid C70 filmsRotational Dynamics in C70 : Temperature- and Pressure-Dependent Infrared StudiesPressure-induced irreversible amorphization of C70 fullerenePressure-Induced Collapse in Double-Walled Carbon Nanotubes: Chemical and Mechanical Screening EffectsRaman signature to identify the structural transition of single-wall carbon nanotubes under high pressure
[1] Yamanaka S, Kini N S, Kubo A, Jida S, and Kuramoto H 2008 J. Am. Chem. Soc. 130 4303
[2] Shang Y, Liu Z, Dong J, Yao M, Yang Z, Li Q, Zhai C, Shen F, Hou X, Wang L, Zhang N, Zhang W, Fu R, Ji J, Zhang X, Lin H, Fei Y, Sundqvist B, Wang W, and Liu B 2021 Nature 599 599
[3] Zhang S, Li Z, Luo K, He J, Gao Y, Soldatov A V, Benavides V, Shi K, Nie A, Zhang B, Hu W, Ma M, Liu Y, Wen B, Gao G, Liu B, Zhang Y, Shu Y, Yu D, Zhou X F, Zhao Z, Xu B, Su L, Yang G, Chernogorova O P, and Tian Y 2022 Natl. Sci. Rev. 9 nwab140
[4] Tang H, Yuan X, Cheng Y, Fei H, Liu F, Liang T, Zeng Z, Ishii T, Wang M S, Katsura T, Sheng H, and Gou H 2021 Nature 599 605
[5] Wang L, Liu B, Li H, Yang W, Ding Y, Sinogeikin S V, Meng Y, Liu Z, Zeng X C, and Mao W L 2012 Science 337 825
[6] Zhang Y, Yao M, Du M, Yao Z, Wang Y, Dong J, Yang Z, Sundqvist B, Kováts P S, and Liu B 2020 J. Am. Chem. Soc. 142 7584
[7] Elliott J A, Sandler J K W, Windle A H, Young R J, and Shaffer M S P 2004 Phys. Rev. Lett. 92 95501
[8] Zang J, Treibergs A, Han Y, and Liu F 2004 Phys. Rev. Lett. 92 105501
[9] Sluiter M H F and Kawazoe Y 2004 Phys. Rev. B 69 224111
[10] Araujo P T, Barbosa N N M, Chacham H et al. 2012 Nano Lett. 12 4110
[11] Li W, Qu F, Liu L, Zhang Z, Liang J, Lu Y, Zhang J, Wang L, Wang C, and Wang T 2022 Angew. Chem. Int. Ed. 61 e202116854
[12] Ye X, Yu P, Shen W, Hu S, Akasaka T, and Lu X 2021 Sol. RRL 5 2100463
[13] Wang S, Li X, Zhang X, Huang P, Fang P, Wang J, Yang S, Wu K, and Du P 2021 Chem. Sci. 12 10506
[14] Yang H, Jin H, Zhen H, Wang Z, Liu Z, Beavers C M, Mercado B Q, Olmstead M M, and Balch A L 2011 J. Am. Chem. Soc. 133 6299
[15] Yang H, Beavers C M, Wang Z, Jiang A, Liu Z, Jin H, Mercado B Q, Olmstead M M, and Balch A L 2010 Angew. Chem. Int. Ed. 49 886
[16] Schettino V, Pagliai M, Ciabini L, and Cardini G 2001 J. Phys. Chem. A 105 11192
[17] Braga S F and Galvão D S 2007 J. Comput. Chem. 28 1724
[18] Wang L, Liu B, Liu D, Yao M, Yu S, Hou Y, Zou B, Cui T, Zou G, Sundqvist B, Luo Z, Li H, Li Y, Liu J, Chen S, Wang G, and Liu Y 2007 Appl. Phys. Lett. 91 103112
[19] Yamawaki H, Yoshida M, Kakudate Y, Usuba S, Yokoi H, Fujiwara S, Aoki K, Ruoff R, Malhotra R, and Lorents D 1993 J. Phys. Chem. 97 11161
[20] Huang Y, Gilson D F R, and Butler I S 1991 J. Phys. Chem. 95 5723
[21] Wagner J, Ramsteiner M, Wild C, and Koidl P 1989 Phys. Rev. B 40 1817
[22] Weiler M, Sattel S, Giessen T, Jung K, Ehrhardt H, Veerasamy V S, and Robertson J 1996 Phys. Rev. B 53 1594
[23] Liu D, Yao M, Wang L, Li Q, Cui W, Liu B, Liu R, Zou B, Cui T, Liu B, Liu J, Sundqvist B, and Wågberg T 2011 J. Phys. Chem. C 115 8918
[24]Maksimov A A, Meletov K P, Osip'yan Y A, Tartakovskii I I, Artemov Y V, and Nudel'Man M A 1993 Sov. J. Exp. Theor. Phys. Lett. 57 816
[25] Rao A M, Menon M, Wang K A, Eklund P C, Subbaswamy K R, Cornett D S, Duncan M A, and Amster I J 1994 Chem. Phys. Lett. 224 106
[26] Thirunavukkuarasu K, Long V C, Musfeldt J L, Borondics F, Klupp G, Kamarás K, and Kuntscher C A 2011 J. Phys. Chem. C 115 3646
[27] Wasa S, Suito K, Kobayashi M, and Onodera A 2000 Solid State Commun. 114 209
[28] Aguiar A L, Barros E B, Capaz R B, Souza F A G, Freire P T C, Filho J M, Machon D, Caillier C, Kim Y A, Muramatsu H, Endo M, and San-Miguel A 2011 J. Phys. Chem. C 115 5378
[29] Yao M, Wang Z, Liu B, Zou Y, Yu S, Lin W, Hou Y, Pan S, Jin M, Zou B, Cui T, Zou G, and Sundqvist B 2008 Phys. Rev. B 78 205411