Chinese Physics Letters, 2019, Vol. 36, No. 8, Article code 085201 Comparison of ITG and TEM Microturbulence in DIII–D Tokamak * Wei Hu (胡威)1,2,3, Hong-Ying Feng (冯虹瑛)4,2,1,3, Wen-Lu Zhang (张文禄)2,5,3,1** Affiliations 1Department of Modern Physics, University of Science and Technology of China, Hefei 230026 2Beijing National Laboratory for Condensed Matter Physics and CAS Key Laboratory of Soft Matter Physics, Institute of Physics, Chinese Academy of Sciences, Beijing 100190 3University of Chinese Academy of Sciences, Beijing 100049 4College of Mechanical and Power Engineering, China Three Gorges University, Yichang 443002 5Songshan Lake Materials Laboratory, Dongguan 523808 Received 5 April 2019, online 22 July 2019 *Supported by the National MCF Energy R&D Program under Grant Nos 2018YFE0304100, 2017YFE0301300 and 2018YFE0311300, the National Natural Science Foundation of China under Grant Nos 11675257, 11675256, 11875067, 11835016 and 11705275, the Strategic Priority Research Program of the Chinese Academy of Sciences under Grant No XDB16010300, the Key Research Program of Frontier Science of the Chinese Academy of Sciences under Grant No QYZDJ-SSW-SYS016, and the External Cooperation Program of the Chinese Academy of Sciences under Grant No 112111KYSB20160039.
**Corresponding author. Email: wzhang@iphy.ac.cn
Citation Text: Hu W, Feng H Y and Zhang W L 2019 Chin. Phys. Lett. 36 085201    Abstract Microturbulence excited by ion temperature gradient (ITG)-dominant and trapped electron mode (TEM)-dominant instabilities is compared in the fusion plasmas using gyrokinetic simulations based on the realistic equilibrium data from DIII–D discharges. Collisions make a difference between two plasmas and give rise to similar results to those found in previous research experiments [Chin. Phys. Lett. 35 (2018) 105201]. The mode structures and frequency spectrum of the most unstable modes characterized by the ITG-dominant and TEM-dominant instabilities are excited in the lower and higher $T_{\rm e}$ plasmas in the linear simulations. In the nonlinear simulations, contour plots of the perturbed potential are shown in the saturated stage, with the radial correlation lengths being microscopic on the order of the ion thermal gyroradius $\rho_{\rm i}$ in both the ITG and the TEM microturbulences. The dominant mode wavelengths of the perturbed potential increase when evolving from linear to nonlinear stages in both simulations, with the fluctuation energy spreading from the linearly dominant modes to the nonlinearly dominant modes. The radial correlation lengths are about 4$\rho_{\rm i}$ and the electron density fluctuation intensities are about 0.85% in the nonlinear saturated stage, which are in agreement with the experimental results. DOI:10.1088/0256-307X/36/8/085201 PACS:52.35.Ra, 52.55.Fa, 52.35.Kt © 2019 Chinese Physics Society Article Text Ion temperature gradient (ITG)[1] mode and trapped electron mode (TEM)[2] instabilities are two types of pronounced drift-wave microturbulence, which can induce anomalous transport in the Tokamak plasmas. ITG microturbulence is found to be responsible for ion transport[1,3] and TEM microturbulence is responsible for the experimentally observed electron heat and particle transport in the long wavelength range[2,4] in the magnetized fusion plasmas. ITG and TEM microturbulence can also induce energetic particle transport, which has been depicted in theoretical,[5,6] simulation[7,8] and experimental[9,10] studies on the magnetic confinement fusion devices. ITG and TEM microturbulences can coexist to enhance the anomalous transport in Tokamak plasmas. It is generally recognized that ITG microturbulence is dominant when the inverse ion temperature gradient scale length exceeds the critical threshold with the inverse electron temperature gradient scale length fixed, and that TEM microturbulence tends to dominate otherwise.[11–13] The wave spectrum distributions of the microturbulence are related to the wave-particle resonance and the finite Larmor radius effect, and thus affect the particle transport and heat diffusivity.[6,7] The wave spectrum distributions of the ITG and TEM microturbulence have been described and compared in many studies. Some investigations showed that TEM microturbulence possesses shorter dominant fluctuation wavelengths compared to the ITG case.[14,15] Some studies found that the dominant fluctuation wavelengths in the two cases are almost the same.[4,16,17] Mertz et al.[18] argued that the relations of the wave spectrum distributions in ITG and TEM microturbulences are diverse and TEM microturbulence could possess longer, shorter or equal dominant fluctuation wavelengths compared to the ITG microturbulence. ITG and TEM microturbulence fluctuation intensities are parameter-dependent, in which the temperature gradient of ions and electrons, density gradient, magnetic shear, ratio of electron temperature to ion temperature, collisions and zonal flows can have an effect.[19,20] Moreover, the ITG and TEM microturbulences can be reduced by interacting with the zonal flows that are excited by themselves as specified in former studies.[2,20] Collisions can affect the microturbulence directly or indirectly through reducing the zonal flows.[21–23] In the DIII–D Tokamak transport experiments, the plasma parameters are almost the same except for the electron temperature in the #142358 (lower $T_{\rm e}$) shot and #142371 (higher $T_{\rm e}$) shot. The electrons were heated through electron cyclotron resonance heating (ECRH), leading to the electron temperature in the later shot being about two times larger than that in the former shot. The electron collisions, the electron temperature gradient and the ratio of electron temperature to ion temperature are thus different in the two shots. The turbulence characteristics ought to be different in the two plasmas as specified in former work.[19,20] However, the radial correlation lengths and electron density fluctuation intensities are almost the same in the ITG and TEM microturbulences in the DIII–D Tokamak.[24] ITG and TEM microturbulences are found to dominate in the lower and higher $T_{\rm e}$ shots, respectively. Former results have shown that the radial correlation lengths and the spectrum distributions are different in ITG and TEM microturbulences.[17] To understand these counter-intuitive experimental results, numerical simulations are conducted in the current work and the collisions were found to be crucial to give rise to the experimental results from previous work.[23] Former studies have shown that the collisions would lead to transition from TEM turbulence to ITG turbulence in the lower $T_{\rm e}$ plasmas. The collisions would decrease the turbulence intensity in the lower $T_{\rm e}$ plasmas but have only a slight effect on the turbulence in the higher $T_{\rm e}$ plasma in the nonlinear saturated stage. In the current work, the characteristics of the microturbulence in these two discharges have been further investigated and compared. The simulation results of the radial correlation lengths and electron density fluctuation intensities are consistent with both the quantitative and the qualitative analyses of the experiments when collisions are included in the simulations. The simulations are carried out with the massively paralleled gyrokinetic particle-in-cell (PIC) code GTC with the realistic equilibrium data from the DIII–D discharges. Gyrokinetic Fokker–Planck equations of the ions and electrons and the gyrokinetic Poisson equation are combined to establish the closed model for the electrostatic plasmas. The gyrokinetic Fokker–Planck equations are described by the $\delta f$ method, which can reduce the particle noise considerably and can decrease the particle number in the simulations. The gyrokinetic Poisson equation can be solved by the iterative method directly or through the Padé approximation method. The turbulence intensity and the energetic particle transport induced by the turbulence are strong at the $r \approx 0.5a$ position in the experiments.[24] For the following simulations, typical parameters are employed: $R/L_{\rm Te}=13.8$, $R/L_{\rm Ti}=8.41$, $R/L_{\rm ne}=3.97$, $m_{\rm i}/m_{\rm e}=1836$, $q=1.37$, and $s=1.17$ in the lower $T_{\rm e}$ case, and $R/L_{\rm Te}=17.7$, $R/L_{\rm Ti}=8.21$, $R/L_{\rm ne}=4.43$, $m_{\rm i}/m_{\rm e}=1836$, $q=1.28$, and $s=1.01$ in the higher $T_{\rm e}$ case at $r=0.5a$, where $R$ is the major radius, $L_{\rm Te}$ and $L_{\rm Ti}$ are the temperature gradient scale lengths of the electrons and ions, respectively, $L_{\rm ne}$ is the density gradient scale length of the electrons, $m_{\rm e}$ and $m_{\rm i}$ are the electron and ion mass, respectively, $q$ is the safety factor, and $s=(r/q)(dq/dr)$ is the magnetic shear. The linear simulations are carried out firstly to give the description of the instability regimes and the mode structures in the lower and higher $T_{\rm e}$ plasmas. The frequency spectrum of the dominant mode derived from the perturbed potential is depicted in the lower two figures in Fig. 1. The negative frequency represents the wave propagating in the ion diamagnetic drift direction with $n=35$ and $m=47$ in the lower $T_{\rm e}$ plasma (ITG) and the positive frequency represents the wave propagating in the electron diamagnetic drift direction with $n=34$ and $m=43$ in the higher $T_{\rm e}$ plasma (TEM). In Fig. 1, ${\it \Omega}_{\rm i}=eB(0)/(m_ic)$ represents the ion cyclotron frequency with $B(0)$ being the on-axis magnetic field strength. The ITG-dominant and TEM-dominant instabilities found in the lower and higher $T_{\rm e}$ simulations, respectively, are in agreement with the experimental results.[24] Global mode structures of the two drift wave instabilities are displayed in the upper two panels of Fig. 1. Through the filtering operation, only one dominant toroidal mode (number $n$) with the largest growth rate is kept in each simulation. All the $m$ harmonics related to the poloidal modes are superposed as seen from the contour plots in the above two figures. The dominant neighboring harmonics tend to have the same phases in the low-field regions, but opposite phases in the high-field regions, which leads to the highly ballooning mode structures in the two simulations.
cpl-36-8-085201-fig1.png
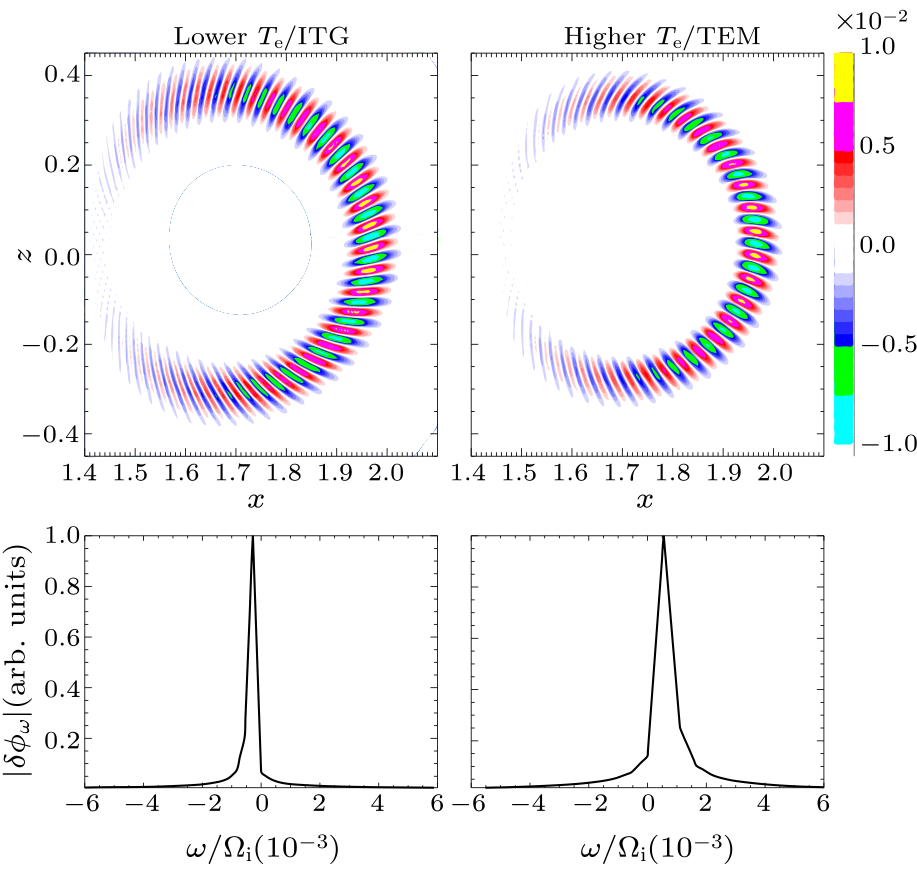
Fig. 1. The upper two figures are the mode structures of the perturbed potential in the poloidal cross section in the linear simulations with a fixed toroidal number $n$. The lower two are the frequency distributions of the most unstable poloidal modes, with the positive frequency referring to the TEM mode (right) and the negative frequency to the ITG mode (left).
Next, the nonlinear simulations are implemented to specify the plasma turbulence in the two cases. Compared to the linear simulations, the nonlinear terms are included in the gyrokinetic model in the nonlinear simulations that can lead to turbulence. Turbulence can also excite zonal flow that would in turn regulate the turbulence that is responsible for the transport. The mode structures of the electrostatic perturbed potential in the nonlinear steady stages are presented in the poloidal cross sections in Fig. 2. Nonlinear mode coupling and the random shearing by the self-generated zonal flows are important in saturating the linear instabilities, modulating the turbulence, and affecting the transport scale.[2,25] They lead to saturated microturbulence and the fluctuation potential is shown with small eddies scattered in the poloidal cross sections in the two simulations.
cpl-36-8-085201-fig2.png
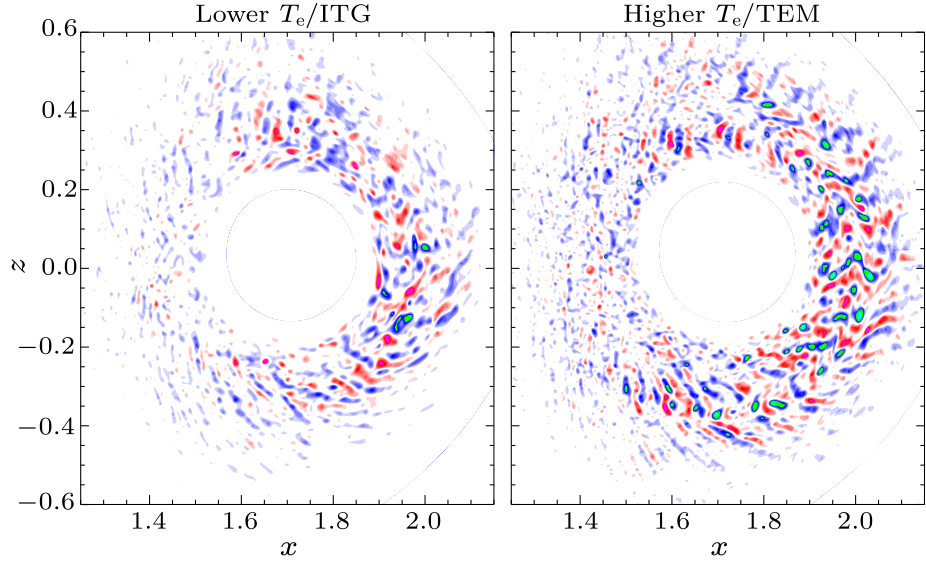
Fig. 2. The global mode structures of the perturbed potential in the poloidal cross section in the nonlinear saturated stages in the two simulations.
cpl-36-8-085201-fig3.png
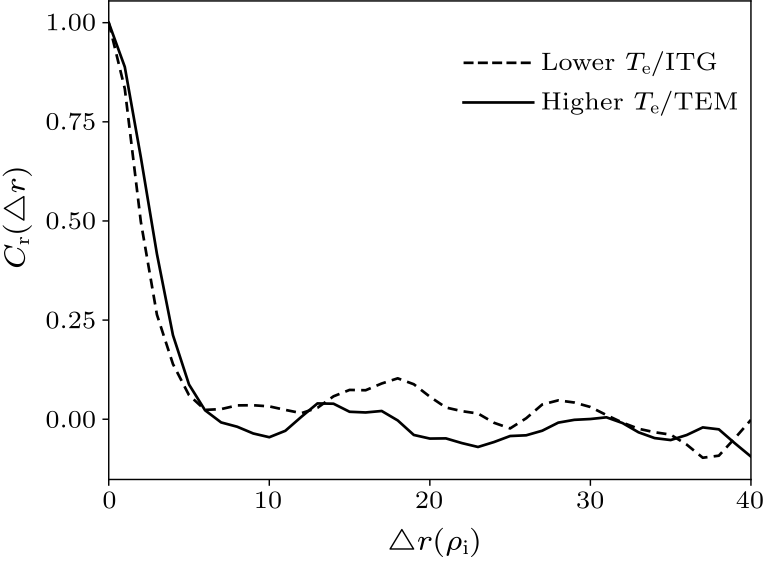
Fig. 3. The radial correlation length versus the radial distance in the nonlinear saturated stages in ITG and TEM microturbulences.
The distribution of the radial correlation length can describe the nonlinear mode structure specifically, which is an important measure of the turbulence character. The two-point correlation function formula is employed to describe the radial correlation as follows: $$ C_r(\Delta r)=\frac{\langle \delta \phi(r+\Delta r, \zeta) \delta \phi(r,\zeta) \rangle} {\sqrt{\langle \delta \phi^2(r + \Delta r, \zeta)\rangle \langle \delta \phi^2(r, \zeta) \rangle}} $$ where $\zeta$ is the toroidal angle, $\Delta r$ is the radial interval, and $\langle \cdots \rangle$ stands for the averaging over the toroidal angle.[1] The radial correlation functions are calculated using the poloidal angle $\theta=0$ at the radial position $r=0.5a$, which is chosen as the reference position in the two simulations. The radial correlations in the two simulations both decay exponentially with $\Delta r$ and no significant tails exist at large radial separations. The lower $T_{\rm e}$ case possesses slightly smaller correlation length in the exponential decay region in Fig. 3. The correlation coefficient is very small and insignificant when the radial interval is larger than $8\rho_{\rm i}$. The mean radial correlation lengths are about $3.8 \rho_{\rm i}$ (2.3 cm) for the ITG microturbulence and $4.3 \rho_{\rm i}$ (2.6 cm) for the TEM microturbulence, which are consistent with the experimental results of the radial correlation length $\lambda_{\rm c}(\rho=0.65\,{\rm cm})>2$ cm in both cases.[24]
cpl-36-8-085201-fig4.png
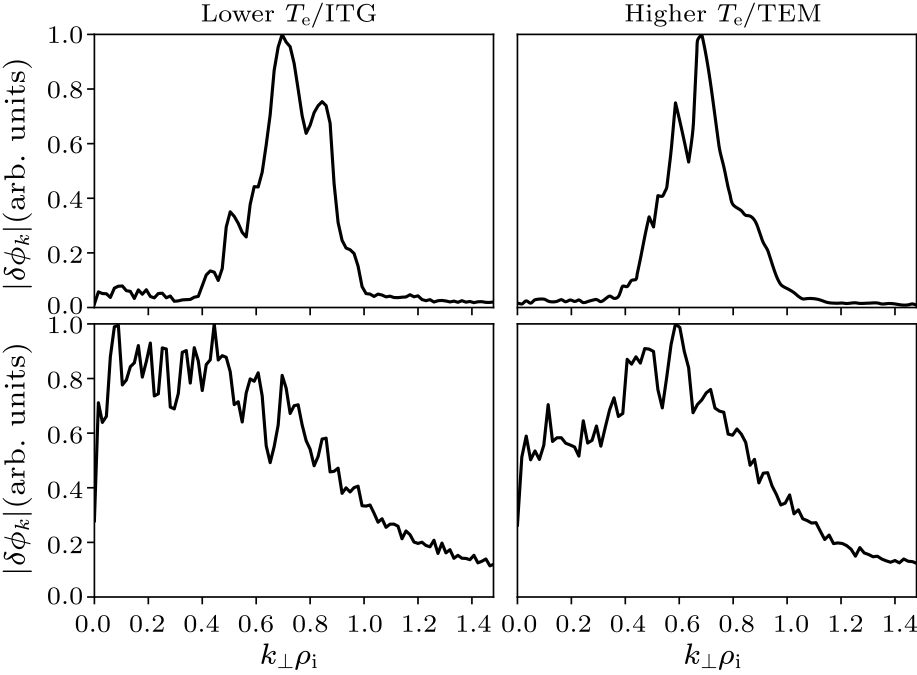
Fig. 4. The wave spectrum distributions of perturbed potential versus perpendicular wavenumber in the linear and nonlinear stages in ITG and TEM microturbulences.
The wave spectrum distributions of the perturbed potential $\delta \phi$ in the normalized perpendicular wave vector space are presented through averaging in the time and radial domain space in the linear and nonlinear stages in Fig. 4. The particle transport and heat diffusivity induced by the microturbulence are connected with the wave spectrum distributions due to the wave-particle resonance and the finite Larmor radius effects. It can be seen that the wave spectrum distributions in the ITG and TEM microturbulences are similar in both the linear and nonlinear stages. In the linear stages, the spectrum distributions are similar to the growth rate distributions in the wavenumber space in Fig. 1 of the former study.[23] This is due to the mode coupling being very weak in the linear stages and the eigenmodes are almost independently excited by the instabilities. In the nonlinear stages, the spectrum intensity distributions are broadened compared to the linear stages with the energy being transferred from the linearly dominant modes to the nonlinearly dominant modes as is seen from the corresponding upper and lower plots in Fig. 4. The change in the spectrum distributions of the microturbulence would affect the wave-particle resonance and the finite Larmor radius effect, and thus would make a difference to the particle transport and heat diffusivity.[6,7] The evolution of the average wavenumber $\langle k_\perp \rho_{\rm i} \rangle$ and their respective spectrum width $\langle \Delta k_\perp \rho_{\rm i} \rangle$ are given in Fig. 5 in the ITG and TEM microturbulences. The following formulas[26] are applied through the weighted microturbulence intensity averaging: $\langle k_\perp \rho_{\rm i} \rangle = \sum_k |\delta\phi_k|^2 k_\perp \rho_{\rm i}/\sum_k |\delta\phi_k|^2$ and $\langle \Delta k_\perp \rho_{\rm i} \rangle = \sqrt {\sum_k |\delta\phi_k|^2(k_\perp \rho_{\rm i} - \langle k_\perp \rho_{\rm i} \rangle)^2/\sum_k |\delta\phi_k|^2}$. The average perpendicular waves evolve from short waves to saturated long waves from the linear stages to the nonlinear stages in both simulations. The average perpendicular wavenumbers in the nonlinear steady stages are about $\langle k_\perp\rho_{\rm i} \rangle_{\rm ITG} =0.45$ and $\langle k_\perp\rho_{\rm i} \rangle_{\rm TEM} =0.52$, which are close in the two simulations.
cpl-36-8-085201-fig5.png
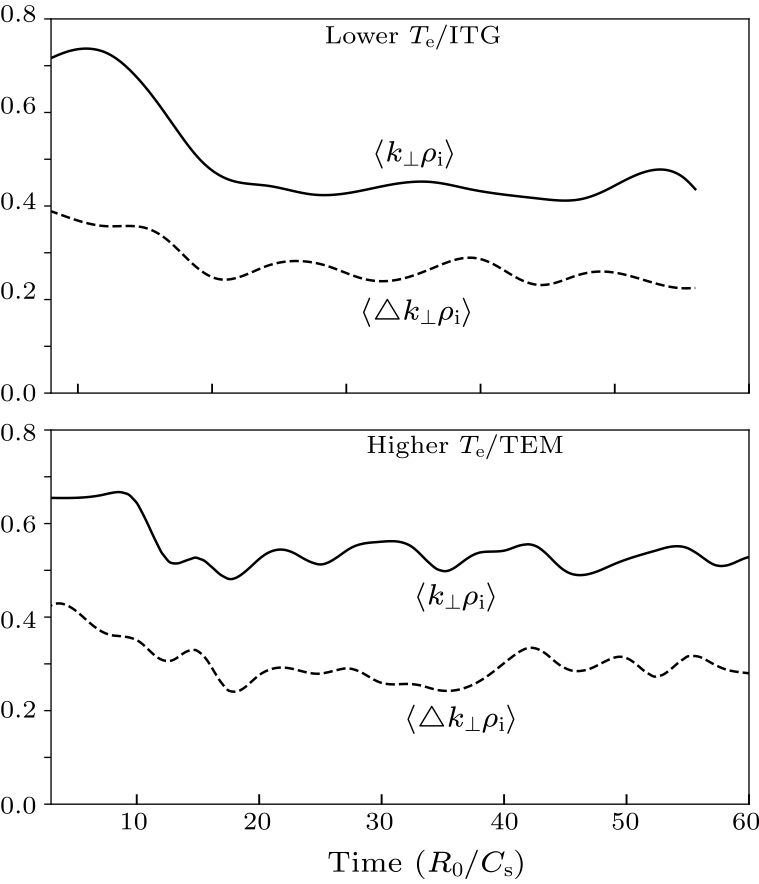
Fig. 5. Evolution of the average perpendicular wave vector lengths and their respective spectrum width in the two simulations. The average perpendicular wave vector value decreases from the linear stage to the nonlinear stage.
cpl-36-8-085201-fig6.png
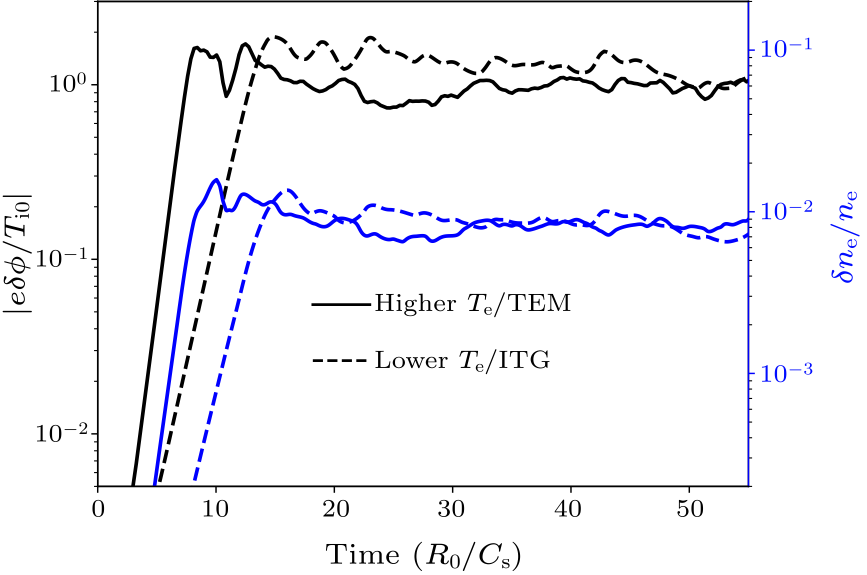
Fig. 6. Comparisons of the perturbed potential intensities and the electron density fluctuation intensities in ITG and TEM microturbulences.
Finally, comparisons of the perturbed potential intensities and the electron density fluctuation intensities are presented in Fig. 6 for ITG and TEM microturbulences. The two physical parameters start with very small random fluctuations, then grow exponentially due to the excitation of the drift wave instabilities, and finally nonlinear coupling among the microturbulence, zonal flows, and collisions leads to the saturated level. The growth rates of the perturbed potential intensities and the electron density fluctuation intensities are the same in the exponential growth stages in the two simulations in each case as shown by the dotted lines. In the nonlinear saturated stages, the perturbed potential intensities and the electron density fluctuation intensities are almost the same in the ITG and TEM microturbulences when the collisions are included in the simulations. A plausible reason for this is that the collisions can decrease the turbulence directly or promote turbulence indirectly by decreasing the zonal flows as specified in former research.[23] When the damping mechanism is stronger than the promotion process, the final turbulence will be decreased as shown in the ITG turbulence. If the damping effect is comparable with the promotion action, the final turbulence will be similar as shown in the TEM turbulence. Thus the collisions play an important role and give rise to the similar turbulence intensity in the lower and higher $T_{\rm e}$ plasmas. Former research has shown that the ion-ion collisions have a slight effect on the turbulence but could damp the zonal flow, leading to the final turbulence being increased by the collisions.[21] The electron density fluctuation intensities are about 0.85% after averaging in the nonlinear saturated stages in the two simulations, which is in agreement with the experimental results in Fig. 13 of Ref.  [24]. In summary, global gyrokinetic particle simulations have been carried out to make comparisons between ITG and TEM microturbulences with the equilibrium data from the DIII–D Tokamak discharges. The collisions make a difference in the simulations and lead to similar results being found in the lower and higher $T_{\rm e}$ Tokamak plasmas as was found in the experimental research in Ref.  [23]. In the nonlinear saturated stages, the radial correlation lengths are close in ITG and TEM microturbulences and are found to be on the order of the ion thermal gyroradius, which is consistent with the experimental results. The wave spectrum distributions of the perturbed potential in the wavenumber domain are similar in both the linear and nonlinear stages in the two simulations. The dominant mode wavelengths increase when evolving from the linear stages to the nonlinear stages, with the fluctuation energy transferring from the linearly dominant modes to the nonlinearly dominant modes. The perturbed potential intensities and electron density fluctuation intensities are also at the similar level in the nonlinear saturated stages in the two simulations. The electron density fluctuation intensities are about 0.85% after averaging in the nonlinear saturated stages in both ITG and TEM microturbulences, which is in agreement with the experimental results. This research used the resources of the National Supercomputer Center in Tianjin (NSCC-TJ).
References Turbulence spreading and transport scaling in global gyrokinetic particle simulationsTurbulent Transport of Trapped-Electron Modes in Collisionless PlasmasComparisons and physics basis of tokamak transport models and turbulence simulationsExperimental Study of Trapped-Electron-Mode Properties in Tokamaks: Threshold and Stabilization by CollisionsTurbulent transport of ions with large Larmor radiiNonlinear gyrokinetic Vlasov equation for toroidally rotating axisymmetric tokamaksTransport of Energetic Particles by Microturbulence in Magnetized PlasmasRadial transport of energetic ions in the presence of trapped electron mode turbulenceInteraction of energetic particles with large and small scale instabilitiesEvidence for Fast-Ion Transport by MicroturbulenceGlobal particle-in-cell simulations of microturbulence with kinetic electronsLinear comparison of gyrokinetic codes with trapped electronsNonlinear saturation of collisionless trapped electron mode turbulence: Zonal flows and zonal densityProgress in anomalous transport research in toroidal magnetic confinement devicesResponse of multiscale turbulence to electron cyclotron heating in the DIII-D tokamakObservations on core turbulence transitions in ASDEX Upgrade using Doppler reflectometryFluctuation characteristics and transport properties of collisionless trapped electron mode turbulenceNonlinear interplay of TEM and ITG turbulence and its effect on transportGyrokinetic simulation of collisionless trapped-electron mode turbulenceGyrokinetic δf particle simulation of trapped electron mode driven turbulenceEffects of Collisional Zonal Flow Damping on Turbulent TransportTurbulence measurements in fusion plasmasCollisional Effects on Drift Wave Microturbulence in Tokamak PlasmasEnergetic ion transport by microturbulence is insignificant in tokamaksSize Scaling of Turbulent Transport in Magnetically Confined PlasmasWave-Particle Decorrelation and Transport of Anisotropic Turbulence in Collisionless Plasmas
[1] Lin Z and Hahm T S 2004 Phys. Plasmas 11 1099
[2] Xiao Y and Lin Z 2009 Phys. Rev. Lett. 103 085004
[3] Dimit A M, Bateman G, Beer M A, Cohen B I, Dorl, W, Hammett G W, Kim C, Kinsey J E, Kotschenreuther M, Kritz A H, Lao L L, Mandrekas J, Nevins W M, Parker S E, Redd A J, Shumaker D E, Sydora R and Weiland J 2000 Phys. Plasmas 7 969
[4] Ryter F, Angioni C, Peeters A, Leuterer F, Fahrbach H U and Suttrop W 2005 Phys. Rev. Lett. 95 085001
[5] Vlad M, Spineanu F, Itoh S I, Yagi M and Itoh K 2005 Plasma Phys. Control. Fusion 47 1015
[6] Chen L 1999 J. Geophys. Res.: Space Phys. 104 2421
[7] Zhang W, Lin Z and Chen L 2008 Phys. Rev. Lett. 101 095001
[8] Chowdhury J, Wang W, Ethier S, Manickam J and Ganesh R 2011 Phys. Plasmas 18 112510
[9] Günter S, Conway G et al 2007 Nucl. Fusion 47 920
[10] Heidbrink W W, Park J M, Murakami M, Petty C C, Holcomb C and van Zeeland M A 2009 Phys. Rev. Lett. 103 175001
[11] Lewandowski J L V, Rewoldt G, Ethier S, Lee W W and Lin Z 2006 Phys. Plasmas 13 072306
[12] Rewoldt G, Lin Z and Idomura Y 2007 Comput. Phys. Commun. 177 775
[13] Lang J Y, Parker S E and Chen Y 2008 Phys. Plasmas 15 055907
[14] Carreras B A 1997 IEEE Trans. Plasma Sci. 25 1281
[15] Rhodes T L, Peebles W A, van Zeeland M A et al 2007 Phys. Plasmas 14 056117
[16] Conway G D, Angioni C, Dux R, Ryter F, Peeters A G, Schirmer J, Troester C et al 2006 Nucl. Fusion 46 S799
[17] Xiao Y, Holod I, Zhang W, Klasky S and Lin Z 2010 Phys. Plasmas 17 022302
[18] Merz F and Jenko F 2010 Nucl. Fusion 50 054005
[19] Dannert T and Jenko F 2005 Phys. Plasmas 12 072309
[20] Lang J, Chen Y and Parker S E 2007 Phys. Plasmas 14 082315
[21] Lin Z, Hahm T, Lee W, Tang W and Diamond P 1999 Phys. Rev. Lett. 83 3645
[22] Conway G D 2008 Plasma Phys. Control. Fusion 50 124026
[23] Hu W, Feng H Y and Dong C 2018 Chin. Phys. Lett. 35 105201
[24] Pace D C, Austin M E, Bass E M, Budny R V, Heidbrink W W, Hillesheim J C, Holcomb C T, Gorelenkova M, Grierson B A, McCune D C, McKee G R, Muscatello C M, Park J M, Petty C C, Rhodes T L, Staebler G M, Suzuki T, Van Zeel, M A, Waltz R E, Wang G, White A E, Yan Z, Yuan X and Zhu Y B 2013 Phys. Plasmas 20 056108
[25] Lin Z, Ethier S, Hahm T and Tang W 2002 Phys. Rev. Lett. 88 195004
[26] Lin Z, Holod I, Chen L, Diamond P, Hahm T and Ethier S 2007 Phys. Rev. Lett. 99 265003